Access Audit Logs#
Introduction#
Hopsworks collects audit logs on all URL requests to the application server. These logs are saved in Payara log directory under <payara-log-dir>/audit by default.
Prerequisites#
In order to access the audit logs you need the following:
- Administrator account on the Hopsworks cluster.
- SSH access to the Hopsworks cluster with a user in the
glassfishgroup.
Step 1: Configure Audit logs#
Audit logs can be configured from the Cluster Settings Configuration tab. You can access the Configuration page of your Hopsworks cluster by clicking on your name, in the top right corner, and choosing Cluster Settings from the dropdown menu.
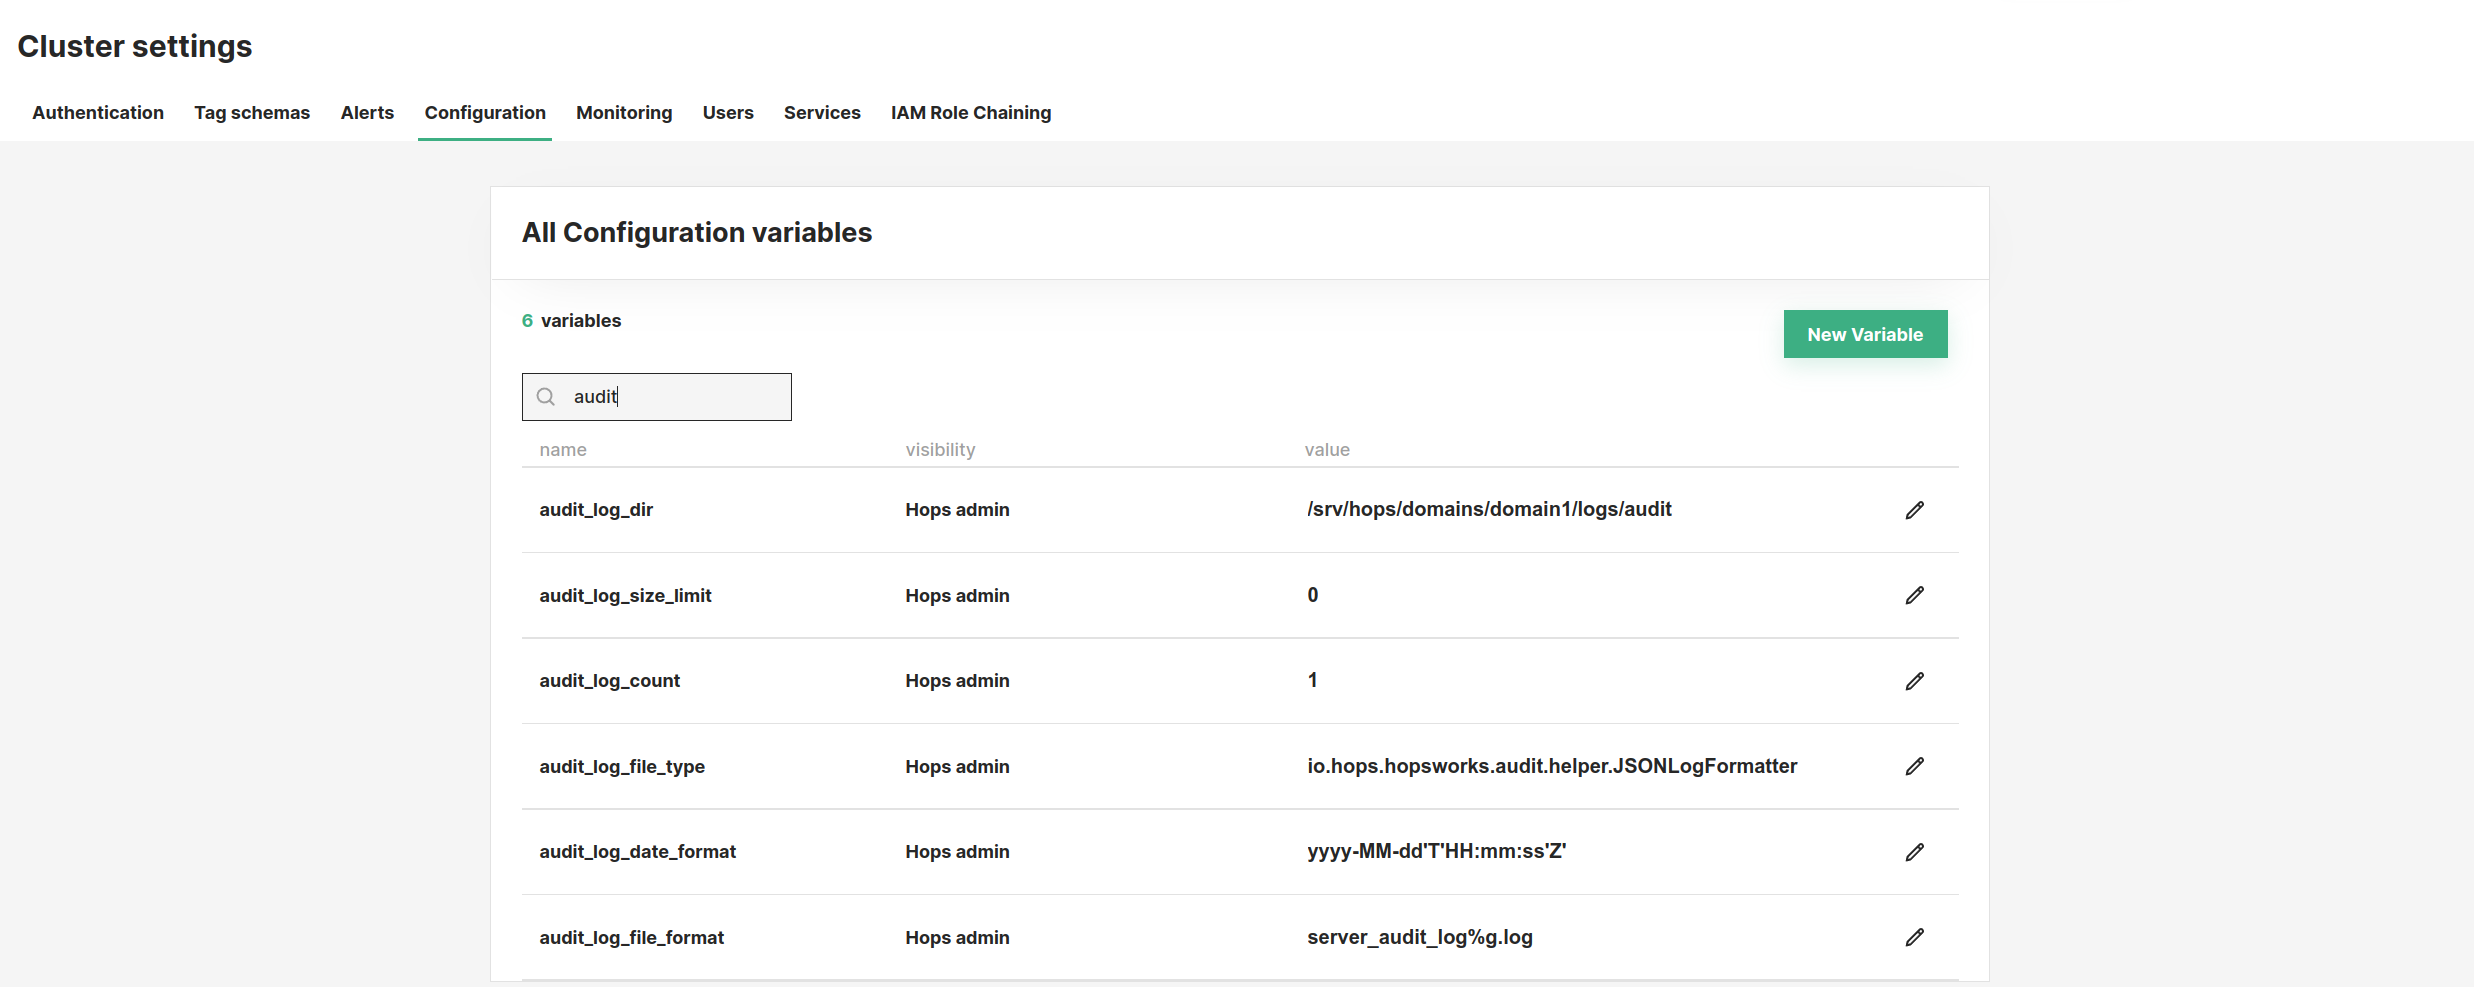
Type audit in the search box to see the configuration variables associated with audit logs. To edit a configuration variable, you can click on the edit button (), insert the new value and save changes clicking on the check mark ().
Audit logs configuration variables
| Name | Description |
|---|---|
| audit_log_count | the number of files to keep when rotating logs (java.util.logging.FileHandler.count) |
| audit_log_dir | the path where audit logs are saved |
| audit_log_file_format | log file name pattern. (java.util.logging.FileHandler.pattern) |
| audit_log_file_type | the output format of the log file. Can be one of java.util.logging.SimpleFormatter (default), io.hops.hopsworks.audit.helper.JSONLogFormatter, or io.hops.hopsworks.audit.helper.HtmlLogFormatter. |
| audit_log_size_limit | the maximum number of bytes to write to any one file. (java.util.logging.FileHandler.limit) |
| audit_log_date_format | if io.hops.hopsworks.audit.helper.JSONLogFormatter is used as audit log file type, this will set the date format of the output JSON. The format should be java.text.SimpleDateFormat compatible string. |
Warning
Hopsworks application needs to be reloaded for any changes to be applied. For doing that, go to the Payara admin panel (https://<your-domain>:4848), click on Applications on the side menu and reload the hopsworks-ear application.
Step 2: Access the Logs#
To access the audit logs, SSH into the head node of your Hopsworks cluster and navigate to the path set in the audit_log_dir configuration variable.
Audit logs follow the format set in the audit_log_file_type configuration variable.
Example of audit logs using JSONLogFormatter
{"className":"io.hops.hopsworks.api.user.AuthService","methodName":"login","parameters":"[admin@hopsworks.ai, org.apache.catalina.connector.ResponseFacade@2de6dd0b, org.apache.catalina.connector.RequestFacade@7a82f674]","outcome":"200","caller":{"username":null,"email":"admin@hopsworks.ai","userId":null},"clientIp":"10.0.2.2","userAgent":"Mozilla/5.0 (X11; Linux x86_64) AppleWebKit/537.36 (KHTML, like Gecko) Chrome/107.0.0.0 Safari/537.36","pathInfo":"/auth/login","dateTime":"2022-11-09 12:00:08"}
Regardless the format, each line in the audit logs can contain the following variables:
Audit log variables
| Name | Description |
|---|---|
| className | the class called by the request |
| methodName | the method called by the request |
| parameters | parameters sent from the client |
| outcome | response code sent from the server |
| caller | the logged in user that made the request. Can be username, email, or userId |
| clientIp | the IP address of the client |
| userAgent | the browser used by the client |
| pathInfo | the URL path called by the client |
| dateTime | time of the request |
Conclusion#
In this guide we showed how you can configure audit logs in Hopsworks from the admin page and access the audit log files via SSH. To learn how to export audit logs, see Export Audit Logs.