Services Logs#
Introduction#
The Hopsworks platform is composed of different services running on different nodes. Hopsworks uses Filebeat, Logstash and OpenSearch to collect, parse, index and present the logs to the Hopsworks administrators.
In this guide you will learn how to access the Hopsworks logs using OpenSearch Dashboards.
Prerequisites#
To access the services logs, you need to have an administrator account on the Hopsworks cluster.
Step 1: Access the Logs#
You can access the admin page of your Hopsworks cluster by clicking on your name, in the top right corner, and choosing Cluster Settings from the dropdown menu.
You can then navigate to the Monitoring tab. The Monitoring tab gives you access to several of the observability tools that are already deployed to help you manage the health of the cluster.
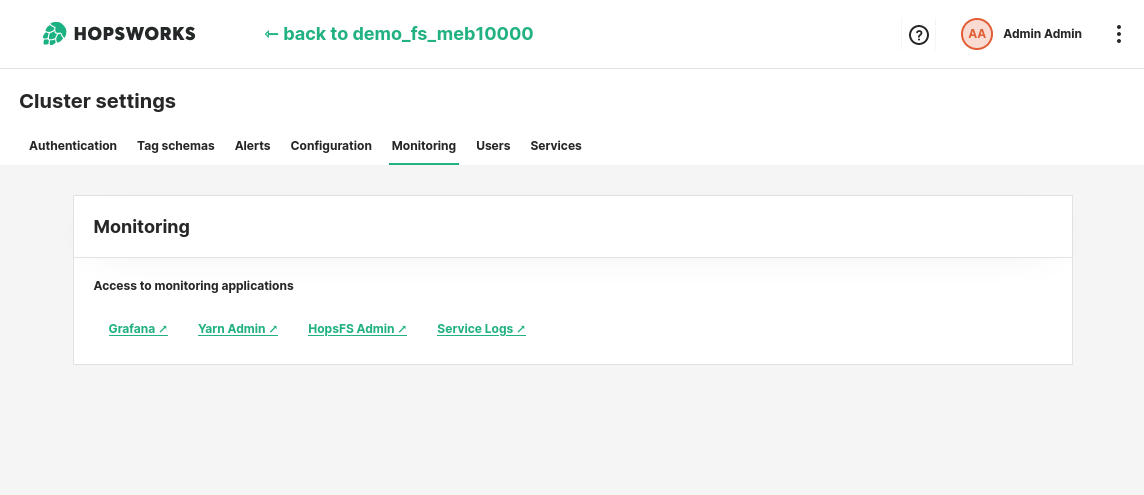
Click on the Service Logs link to open the OpenSearch Dashboards web application and navigate through the logs.
Step 2: Search the logs#
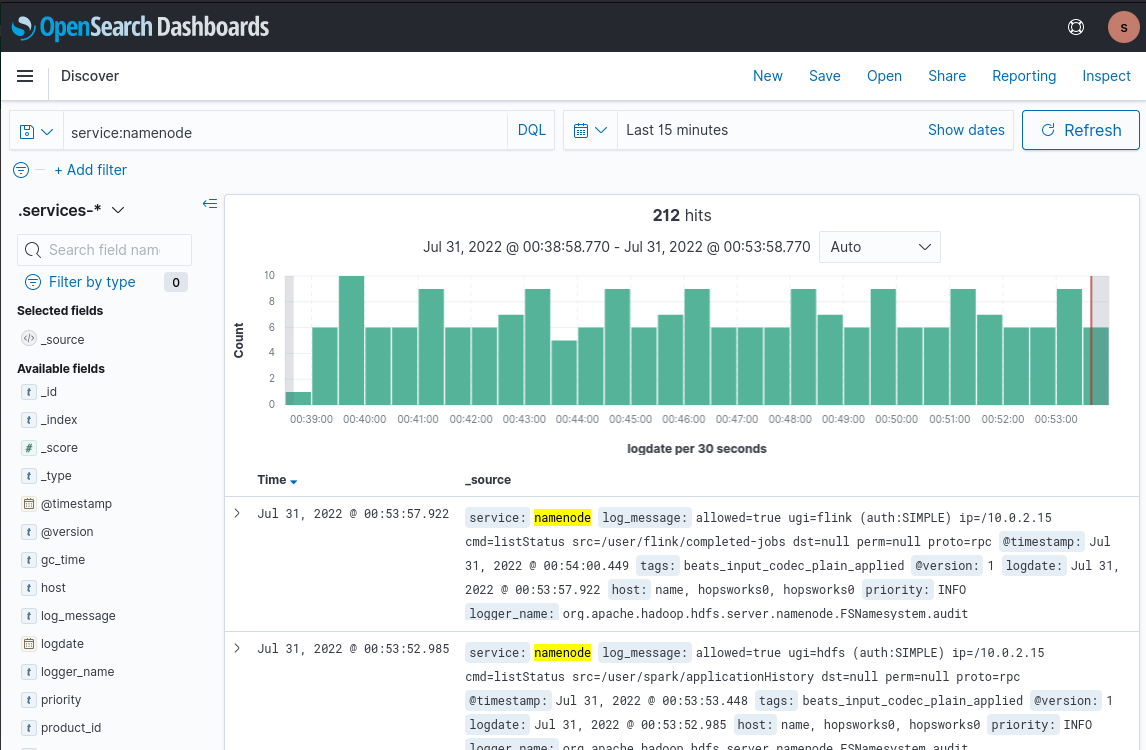
In the OpenSearch dashboard web application you will see by default all the logs generated by all monitored services in the last 15 minutes.
You can filter the logs of a specific service by searching for the term service:[service name]. As shown in the picture below, you can search for the namenode logs by querying service:namenode.
Currently only the logs of the following services are collected and indexed: Hopsworks web application (called domain1 in the log entires), namenodes, resource managers, datanodes, nodemanagers, Kafka brokers, Hive services and RonDB. These are the core component of the platform, additional logs will be added in the future.
Warning
By default, logs are rotated automatically after 7 days. This means that by default, you will not be able to access logs through OpenSearch Dashboards which are older than 7 days. Depending on the service and on the Hopsworks configuration, you can still access the logs by SSH directly into the machines of the cluster.
Conclusion#
In this guide you learned how to access the services logs using OpenSearch Dashboards from the Hopsworks admin page.
You can find additional documentation on OpenSearch Dashboards at: https://opensearch.org/docs/latest/