Time-To-Live (TTL)
Feature Group TTL Usage Guide#
Time To Live (TTL) is a feature that automatically expires data in feature groups after a specified time period. This guide explains when and how to use TTL in your feature groups.
Use Case: When to Use TTL#
TTL is particularly useful for feature groups that contain time-sensitive data that becomes stale or irrelevant after a certain period. Common use cases include:
- Regulatory compliance: Data that must be automatically purged after a retention period for privacy or compliance reasons (e.g., GDPR, HIPAA)
- Cost optimization: Reducing storage costs by automatically removing outdated data that is no longer needed for model inference
- Data freshness: Ensuring that only recent, relevant data is available for online serving, preventing models from using stale features
For example, if you're building a recommendation system, you might want user interaction features (like "items viewed in the last hour") to automatically expire after 1 hour, ensuring your model only uses current, relevant data.
Getting Started#
Creating a Feature Group with TTL#
When creating a new feature group, you can enable TTL by specifying the ttl parameter. The TTL value determines how long data will remain in the feature group before being automatically expired. The TTL is calculated based on the event_time column. Data rows where event_time is older than the TTL period will be automatically removed.
from datetime import datetime, timezone

import pandas as pd

# Assume you already have a feature store handle
# fs = ...

now = datetime.now(timezone.utc)
df = pd.DataFrame(
    {
        "id": [0, 1, 2],
        "timestamp": [now, now, now],
        "feature1": [10, 20, 30],
        "feature2": ["a", "b", "c"],
    }
)

# Create a feature group with TTL enabled (60 seconds)
fg = fs.create_feature_group(
    name="fg_ttl_example",
    version=1,
    primary_key=["id"],
    event_time="timestamp",
    online_enabled=True,
    ttl=60,  # TTL in seconds - data will expire after 60 seconds
)

fg.insert(
    df,
    write_options={
        "start_offline_materialization": False,
        "wait_for_online_ingestion": True,
    },
)

# After 60 seconds, reading online will return empty data
fg.read(online=True)  # Returns empty DataFrame after TTL expires
For detailed API reference on all possible types of TTL values, see the FeatureStore.create_feature_group API documentation.
Managing TTL on Existing Feature Groups#
Updating the TTL Value#
You can change the TTL value for an existing feature group at any time. This is useful when you need to adjust the retention period based on changing requirements.
# Get your existing feature group
fg = fs.get_feature_group(
    name="fg_ttl_example",
    version=1,
)

# Update TTL to a new value (120 seconds = 2 minutes)
fg.enable_ttl(ttl=120)
After updating the TTL, the new retention period will apply to all future data insertions and will affect when existing data expires.
Disabling and Re-enabling TTL#
You can temporarily disable TTL on a feature group if you need to retain data indefinitely, and then re-enable it later.
Disabling TTL#
Re-enabling TTL#
When re-enabling TTL, you have two options:
-
Re-enable with the previous TTL value: If you don't specify a TTL value, the feature group will use the last TTL value that was set.
-
Re-enable with a new TTL value: Specify a new TTL value when re-enabling.
Important: If TTL was never set on the feature group before, you must provide a TTL value when enabling it. Otherwise, TTL cannot be enabled.
Enabling TTL on an Existing Feature Group#
If you created a feature group without TTL initially, you can enable it later:
# Get an existing feature group that was created without TTL
fg = fs.get_feature_group(
    name="fg_existing_no_ttl",
    version=1,
)

# Enable TTL for the first time (60 seconds)
fg.enable_ttl(ttl=60)
Once enabled, TTL will apply to all data in the feature group based on the event_time column. For detailed API reference on all possible types of TTL values and additional options, see the FeatureGroup.enable_ttl API documentation.
Monitoring TTL Purging#
Expired rows stop appearing in query results as soon as their TTL passes. Deleting them from storage happens separately, in the background. A purge worker inside each RonDB REST Server (RDRS) process walks every TTL-enabled online table one partition at a time, deleting a batch of expired rows on each pass. Hopsworks reports what that worker is doing in two places.
On the Feature Group Page#
A TTL purge card appears on the feature group overview whenever the feature group is online enabled and has a TTL.
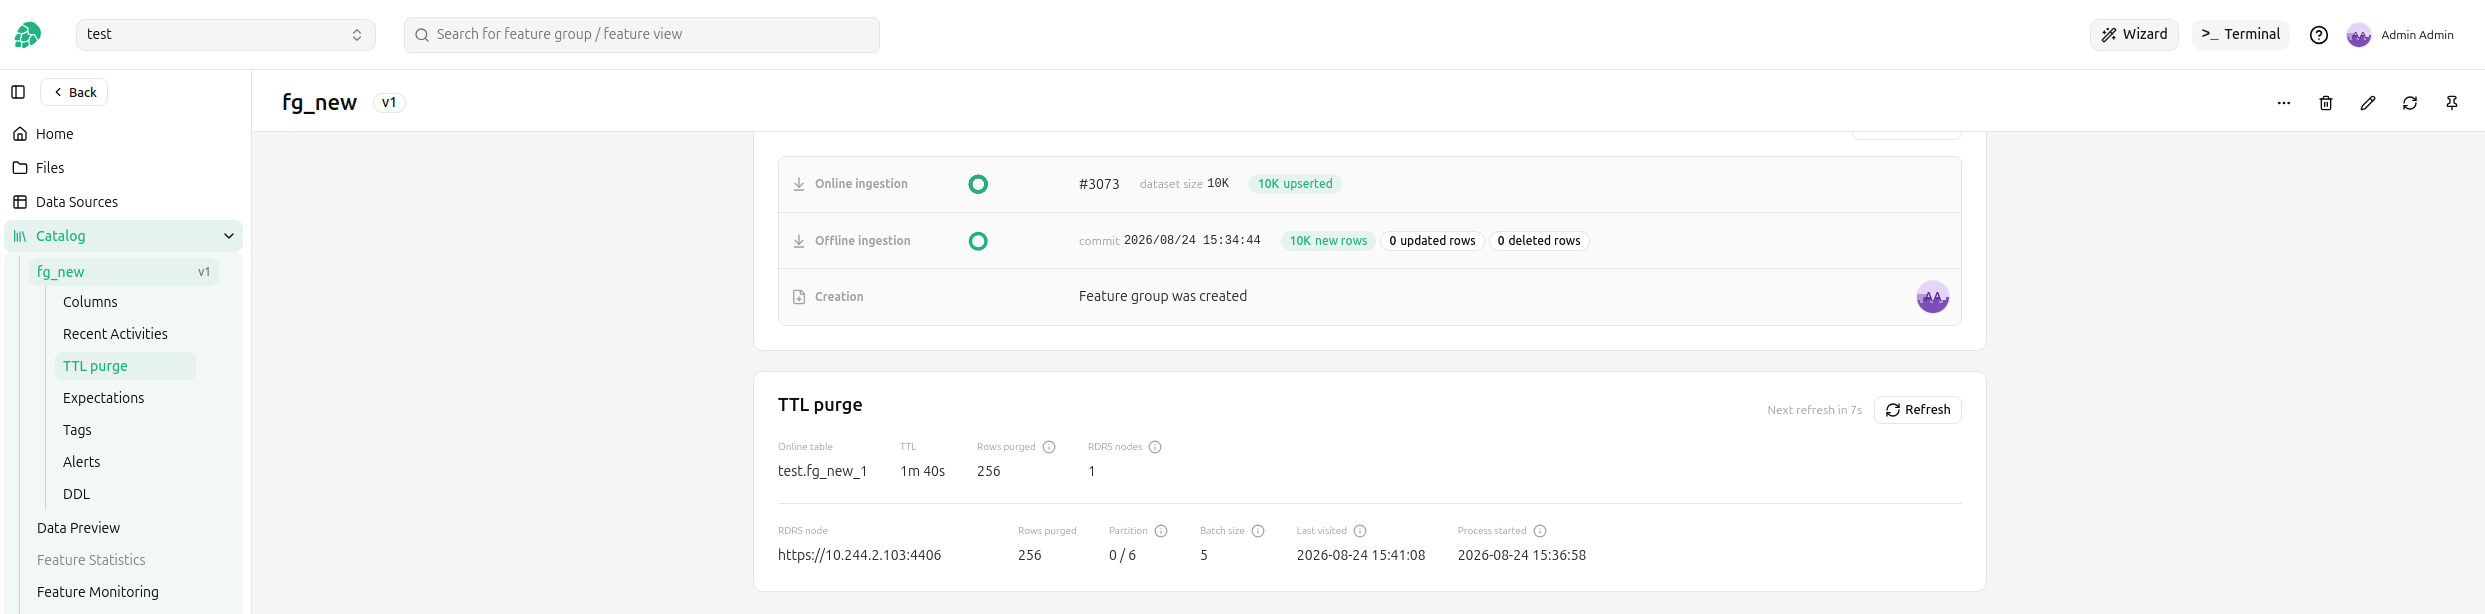
The summary row describes the table as a whole:
| Field | Meaning |
|---|---|
| Online table | The online table backing this feature group, as database.table |
| TTL | The retention period the purge worker read from the table's schema |
| Rows purged | Rows deleted from this table, summed over the nodes that answered |
| RDRS nodes | How many RonDB REST Server processes reported on this table |
One row follows per RDRS node, because each node runs its own worker over its own partitions:
| Field | Meaning |
|---|---|
| RDRS node | The node these counters came from |
| Rows purged | Rows this node deleted from the table |
| Partition | Where this node's cursor sits in the table's partition rotation |
| Batch size | Rows attempted per partition visit, which the worker adapts on its own |
| Last visited | When this node last visited the table |
| Process started | When this node's RDRS process last started, so you can tell how much history its row count covers |
A feature group created moments ago is not listed straight away. RDRS discovers TTL-enabled tables on a periodic schema scan, so for the first few seconds the card reports that no purge worker is tracking the feature group yet. It starts reporting counters on the next scan.
Cluster-Wide#
Administrators can see every RDRS node's purge worker under Settings → TTL Purge.
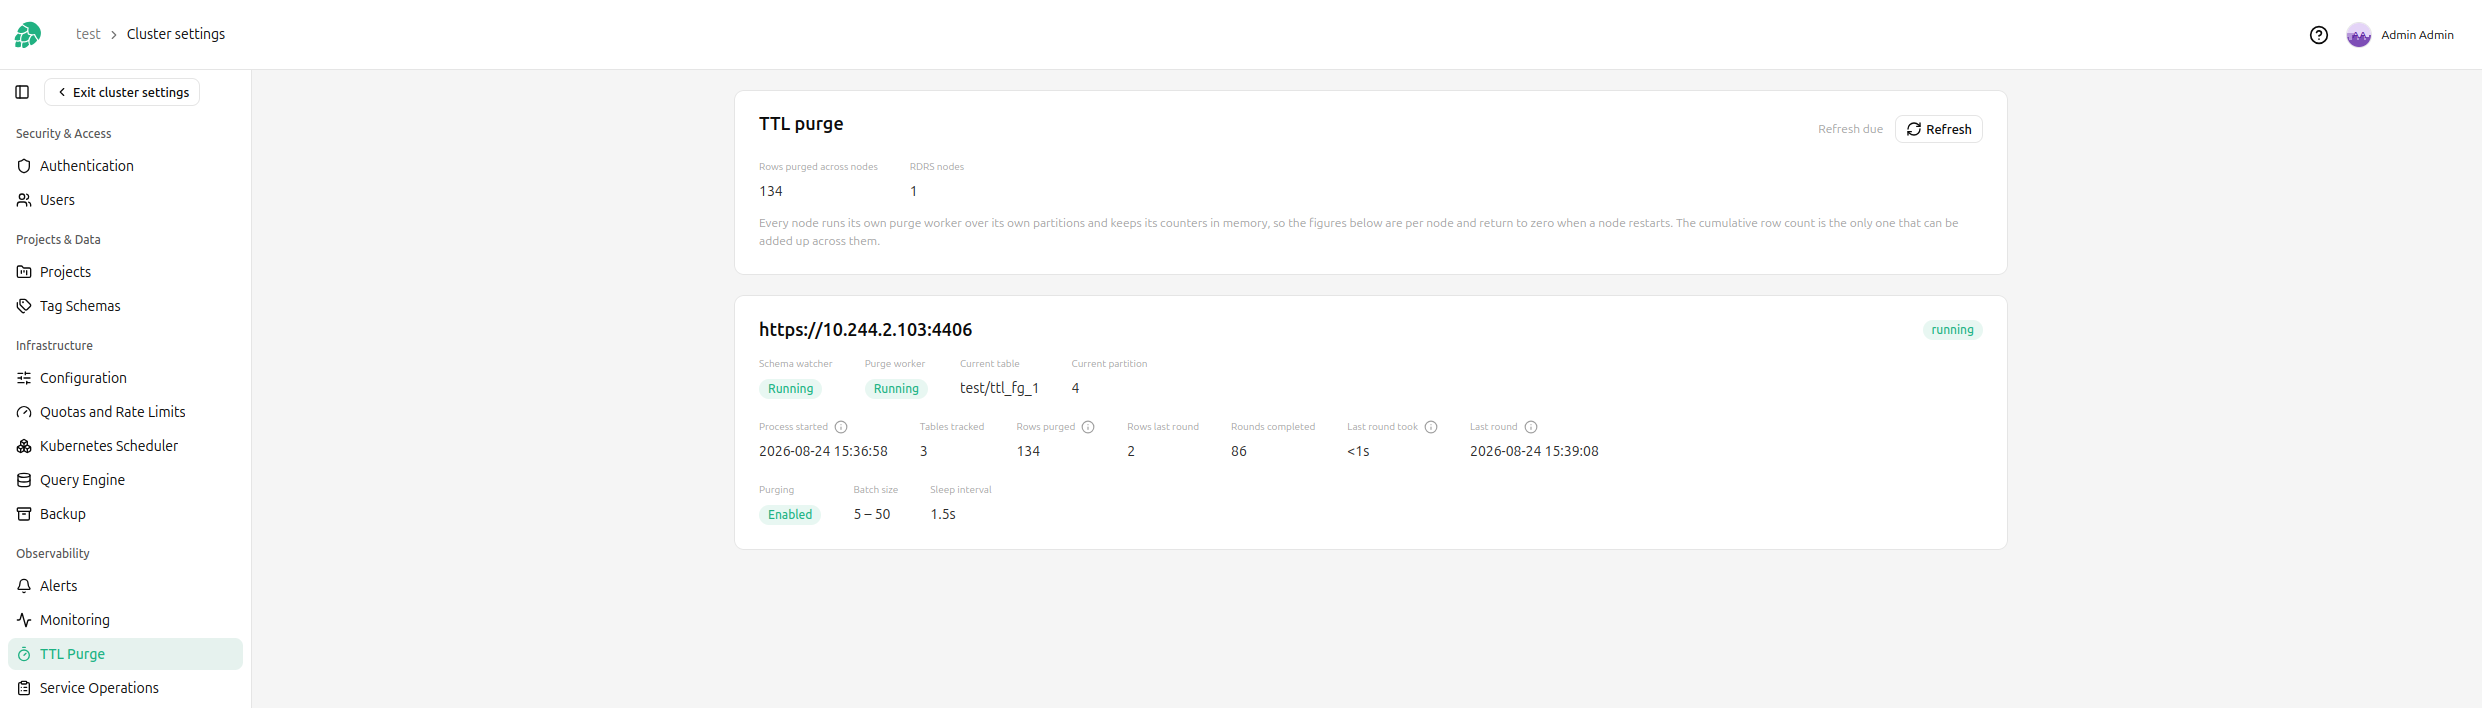
Each node reports a state:
| State | Meaning |
|---|---|
running | Actively purging |
paused | Healthy, but no TTL-enabled tables exist to work on |
disabled | Purging is switched off by configuration |
outside window | Outside the configured daily purge window |
stopped | Not started yet |
error | The worker hit an error, and the RDRS log has the detail |
Only error indicates a fault. A cluster with no TTL-enabled feature groups sits in paused, which is the healthy idle state.
Alongside the state, each node reports its counters (tables tracked, rows purged, rounds completed), the configuration it is running with (batch size range, sleep interval), and when its process last started. A restart count sits next to that timestamp, counting restarts of the container within its current pod; replacing the pod, as a redeploy does, starts a fresh count, so the start time is the figure to trust. Both views poll every ten seconds, show when the next refresh is due, and offer a Refresh button for an immediate read.
Reading the Numbers#
A few properties of these counters are worth knowing before you draw conclusions from them.
The numbers are per RDRS node, and a node is not a datanode. A node here is a RonDB REST Server process. Scaling RDRS changes how many rows the views list; adding datanodes does not, and shows up instead as a larger partition count. Each node keeps its counters in memory and starts again from zero when its process restarts, and nothing is persisted. Because different nodes purge different partitions, their per-table numbers legitimately differ. The cumulative row count is the only figure that is summed across nodes.
A counter is only as old as the process reporting it. Nothing is persisted, so every figure on these views runs from the moment that node's RDRS process last started, which both views report as Process started. Read a low row count against that time rather than on its own: a worker that has been up for a minute and one that has been quietly idle for a week look identical without it.
A round that deleted nothing still counts as activity. The last round timestamp advances on every pass, including passes that found nothing to delete. It tells you the worker is alive, not that rows were removed.
Rows that are already expired when you insert them never reach the online store. Rows whose event_time is older than the TTL at insert time are filtered out before they are written, so they are never counted as purged. To watch the purge worker at work, insert rows that expire after they are written:
from datetime import datetime, timedelta, timezone

import pandas as pd

# Assume you already have a feature group with a TTL
# fg = ...

size = 100
now = datetime.now(timezone.utc)
df = pd.DataFrame(
    {
        "id": range(size),
        # One second apart, so the rows come up for purging at a steady rate
        # instead of the whole batch expiring at once.
        "timestamp": pd.date_range(now, periods=size, freq=timedelta(seconds=1)),
        "feature1": range(size),
    }
)

fg.insert(df)
A batch size sitting at its configured maximum means the worker is behind. The worker raises the batch size while there is a backlog and lowers it once it catches up, so a value pinned at the maximum shown on the cluster-wide page is the clearest sign that purging is not keeping up with expiry.