How To Troubleshoot A Model Deployment#
Introduction#
In this guide, you will learn how to troubleshoot a deployment that is having issues to serve a trained model. But before that, it is important to understand how deployment states are defined and the possible transitions between conditions.
Before a deployment starts, it goes through a CREATING phase where deployment artifacts are prepared. When a deployment is starting, it follows an ordered sequence of states before becoming ready for serving predictions. Similarly, it follows an ordered sequence of states when being stopped, although with fewer steps.
FAILED is a terminal state
If a deployment reaches the FAILED state, it cannot recover on its own. You must stop and restart the deployment to attempt recovery.
Web UI#
Step 1: Inspect deployment status#
If you have at least one deployment already created, navigate to the deployments page by clicking on the Deployments tab on the navigation menu on the left.
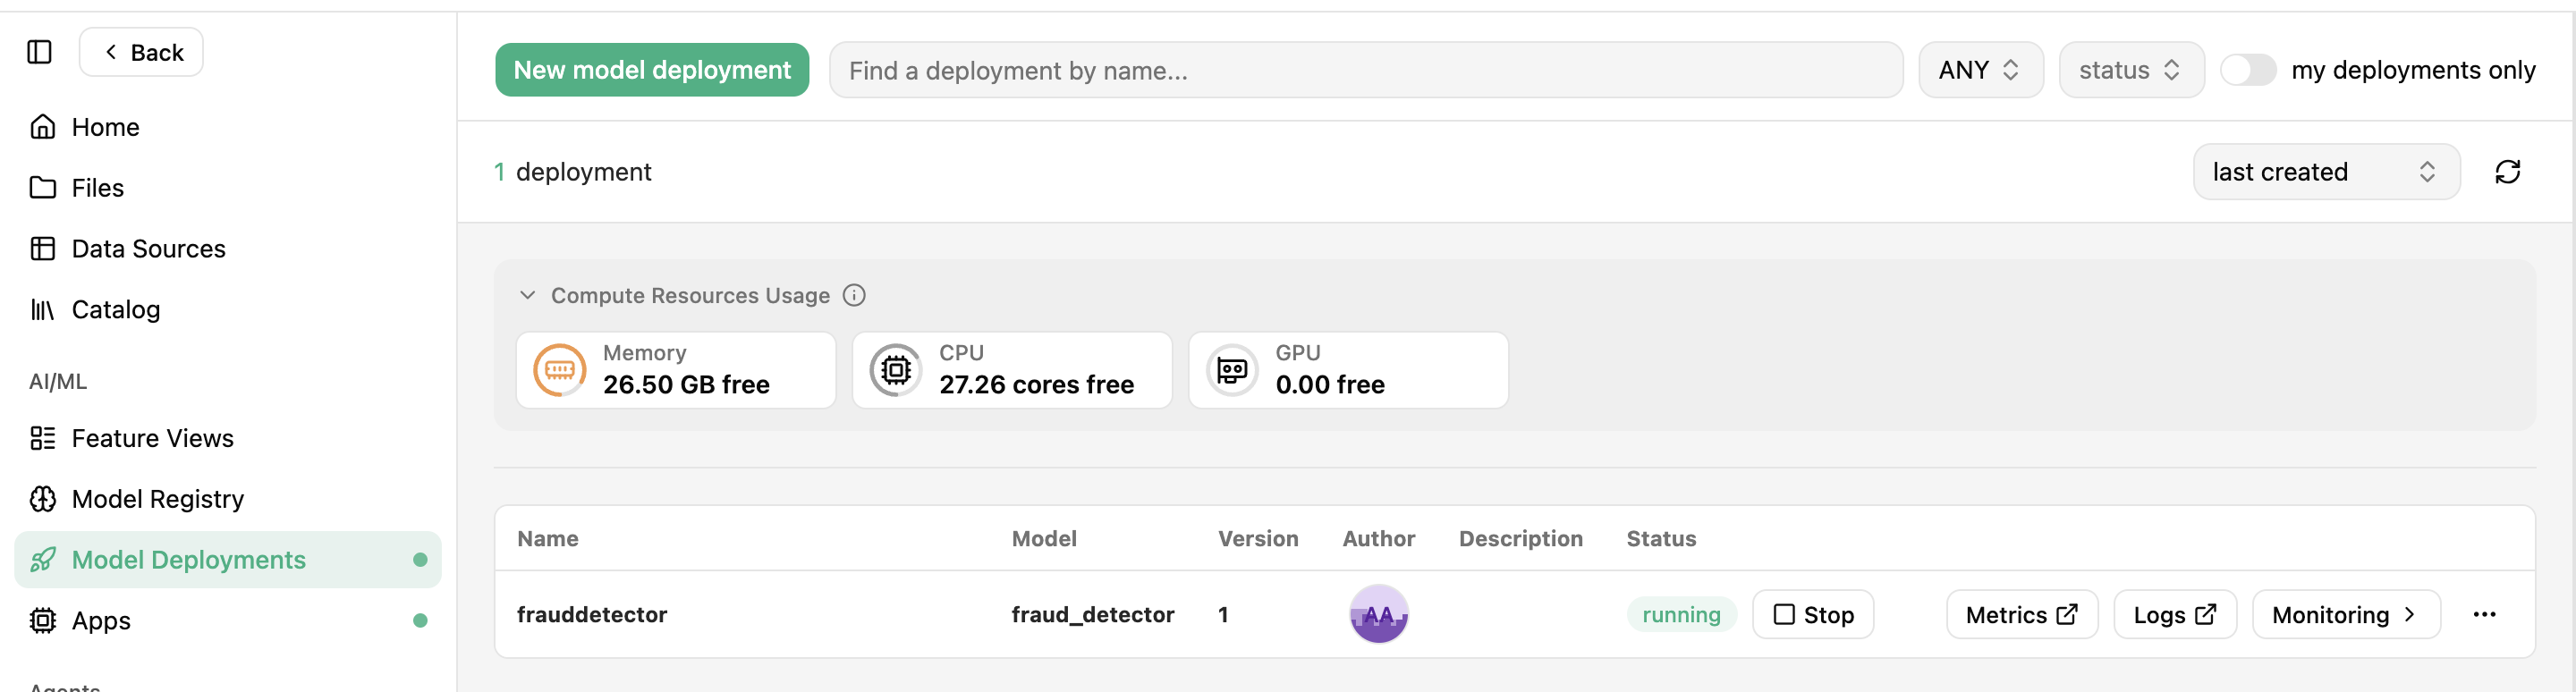
Once in the deployments page, find the deployment you want to inspect. Next to the actions buttons, you can find an indicator showing the current status of the deployment. For a more descriptive representation, this indicator changes its color based on the status.
To inspect the condition of the deployment, click on the name of the deployment to open the deployment overview page.
Step 2: Inspect condition#
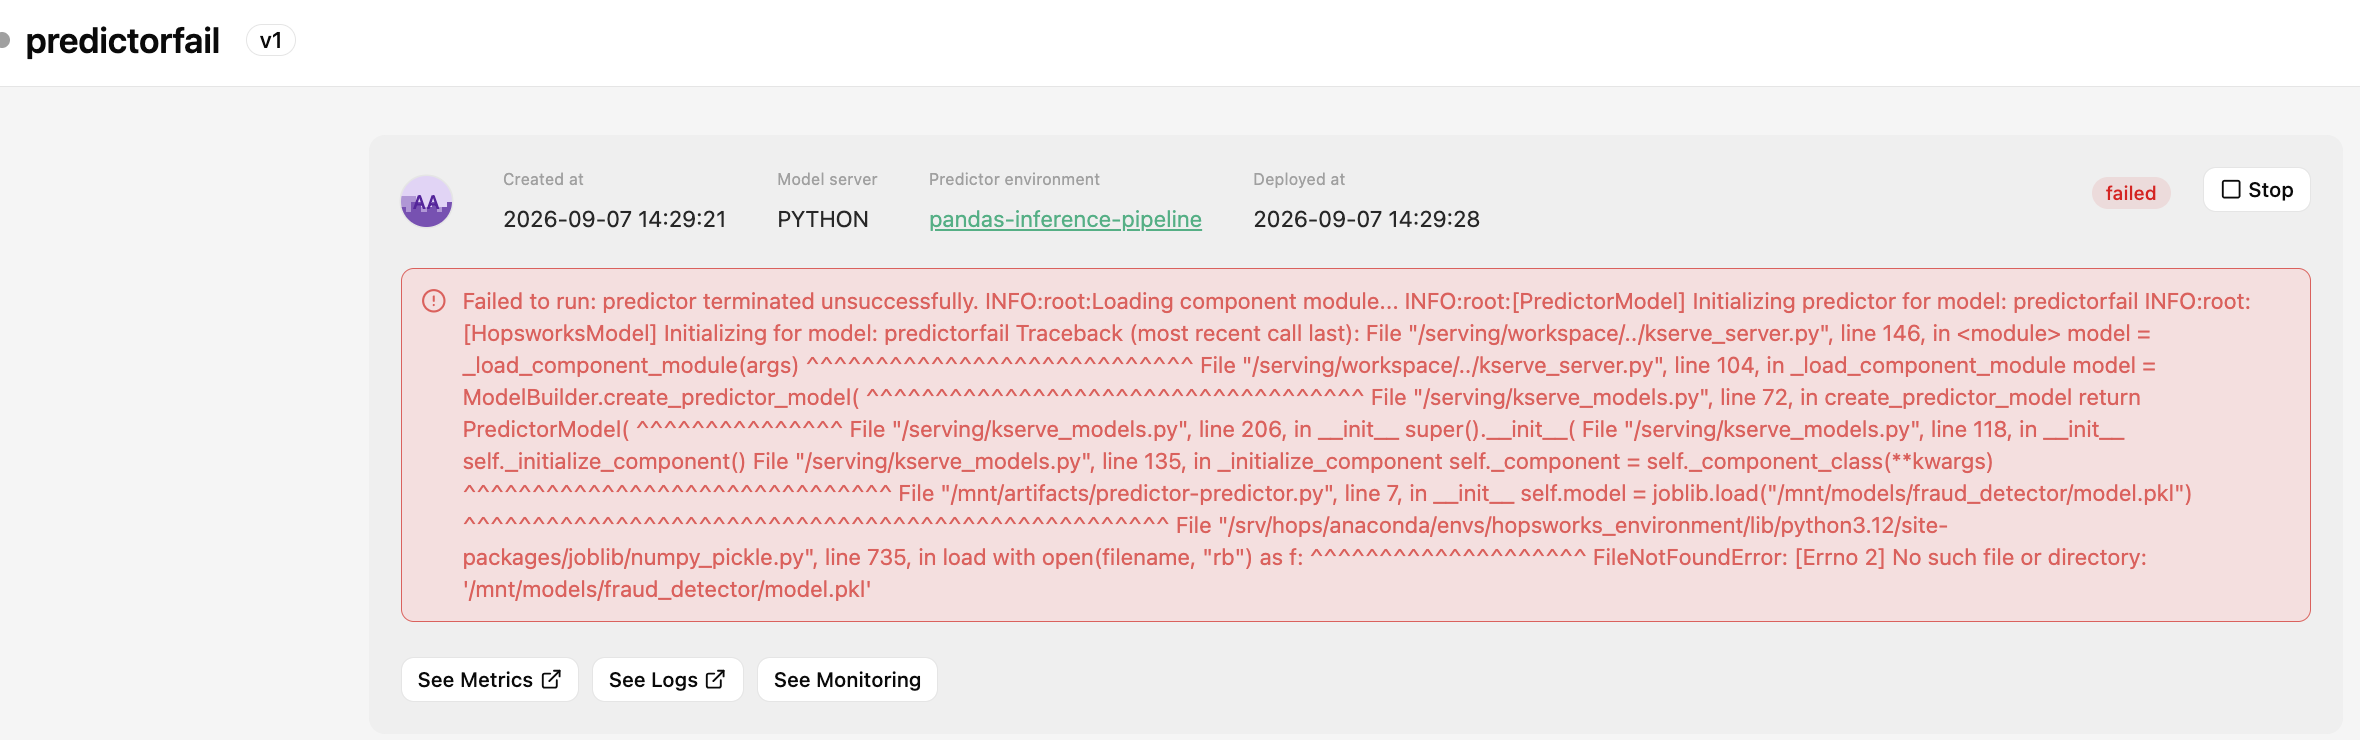
At the top of page, you can find the same status indicator mentioned in the previous step. Below it, a one-line message is shown with a more detailed description of the deployment status. This message is built using the current status condition of the deployment.
Oftentimes, the status and the one-line description are enough to understand the current state of a deployment. For instance, when the cluster lacks enough allocatable resources to meet the deployment requirements, a meaningful error message will be shown with the root cause.

However, when the deployment fails to start further details might be needed depending on the source of failure. For example, failures in the initialization or starting steps will show a less relevant message. In those cases, you can explore the deployments logs in search of the cause of the problem.
Step 3: Explore transient logs#
Each deployment is composed of several components depending on its configuration and the model being served. Transient logs refer to component-specific logs that are read directly from the running component. Therefore, these logs can only be retrieved as long as the deployment components are running.
Transient logs are informative and fast to retrieve, facilitating the troubleshooting of deployment components at a glance.
Transient logs are convenient when access to the most recent logs of a deployment is needed.
To follow them in the UI, click the Logs button at the top of the deployment overview page. The pane tails the selected component every two seconds and lets you search, copy and download what it has buffered. You can also read them with the Hopsworks Machine Learning Python library, as shown in Step 4 of the code section.
Info
When a deployment is in idle state, there are no components running (i.e., scaled to zero) and, thus, no transient logs are available. Use historical logs to inspect an instance that is already gone.
Note
Standard output and standard error arrive as a single interleaved stream. Kubernetes merges them at the container runtime, so the two cannot be separated after the fact.
Step 4: Explore historical logs#
Historical logs are archives that each instance writes to the project's Logs dataset from inside its own container. An instance archives its output when it exits, is restarted, or is stopped, which means an instance removed by scale-to-zero or replaced by a new deployment revision still leaves its logs behind.
Historical logs are convenient when a deployment fails occasionally, or when the instance you need to inspect is no longer running.
Archives are written to Logs/Serving/<deployment_name>/ and named <UTC yyyyMMdd-HHmmss>_<pod>_<component>.log, one file per instance run. Browse them under the Logs section of the deployment overview page, or in the Logs dataset, and open one to read it.
Historical logs are only written for components that have disk logging enabled. See configuring disk logging below, and note that only Python deployments support it: Python predictors have it on by default. Every instance of the component writes its own archive, distinguished by pod name.
Warning
The number of archives kept per deployment is capped by the log_history_limit cluster variable, which defaults to 30. Once the cap is reached, the oldest archive is deleted each time a new one is written, so long-lived deployments do not fill the project with logs.
To retrieve archives with the Python library, use deployment.download_logs(), shown in Step 5 below.
Configuring disk logging#
Disk logging controls whether a component archives its output to the project's Logs dataset. It is a per-component checkbox under Disk logging in the advanced options of the deployment form.
When it is on, each instance keeps its output on local disk while it runs and uploads it when it stops, to a separate file distinguished by pod name. This covers stops the platform initiates on its own, such as scale-to-zero and revision replacement, not only stops a user asks for. When it is off, nothing is written.
Disk logging is only available for deployments whose serving container runs a Hopsworks inference pipeline image, because the upload runs the Hopsworks Python library from inside that container. That means Python deployments, agent deployments included, and their transformers; Python predictors have it on by default. TensorFlow Serving and vLLM do not support it, and neither does a KServe Python deployment with no predictor script, which runs the sklearnserver runtime image. The API rejects the setting for those rather than deploying something that cannot archive.
Note
There is no single-instance mode. All instances of a deployment share one pod template, so they either all archive or none do.
Note
Changing disk logging starts a new deployment revision, because it changes the pod template.
Code#
Step 1: Connect to Hopsworks#
import hopsworks


project = hopsworks.login()

# get Hopsworks Model Serving handle
ms = project.get_model_serving()
Step 2: Retrieve an existing deployment#
Step 3: Get current deployment's predictor state#
Step 4: Explore transient logs#
To follow a running deployment instead of taking a single snapshot, use tail_logs. It returns a generator that yields new lines as they arrive, skipping what it has already yielded.
Step 5: Download historical logs#
local_paths = deployment.download_logs(latest=True)
for local_path in local_paths:
    with open(local_path) as archive:
        print(archive.read())
Omit latest to download every archive the deployment has kept.