Data exploration and data visualization (Superset)#
Apache Superset is a modern data exploration and visualization platform integrated with Hopsworks. It provides an intuitive interface for creating interactive dashboards, running SQL queries, and building advanced visualizations on top of your feature data.
Prerequisites#
To use Superset, you need:
- Membership in a Hopsworks project with Superset enabled
- Appropriate project role permissions (Data Owner or Data Scientist)
Accessing Superset#
Access Superset from your Hopsworks project:
- Navigate to your project in Hopsworks
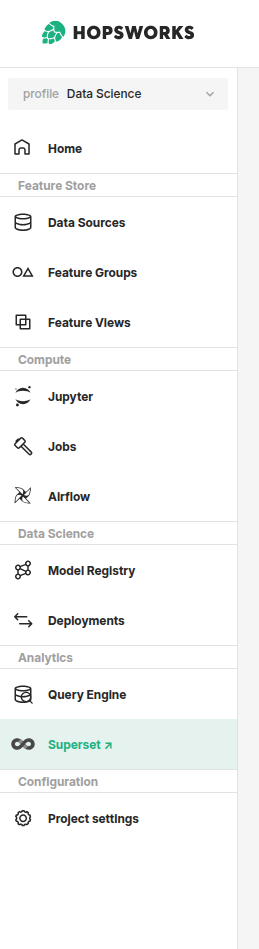
- In the left sidebar, locate the Analytics section
- Click on Superset
This opens the Superset dashboards page, which lists all dashboards available in your project.
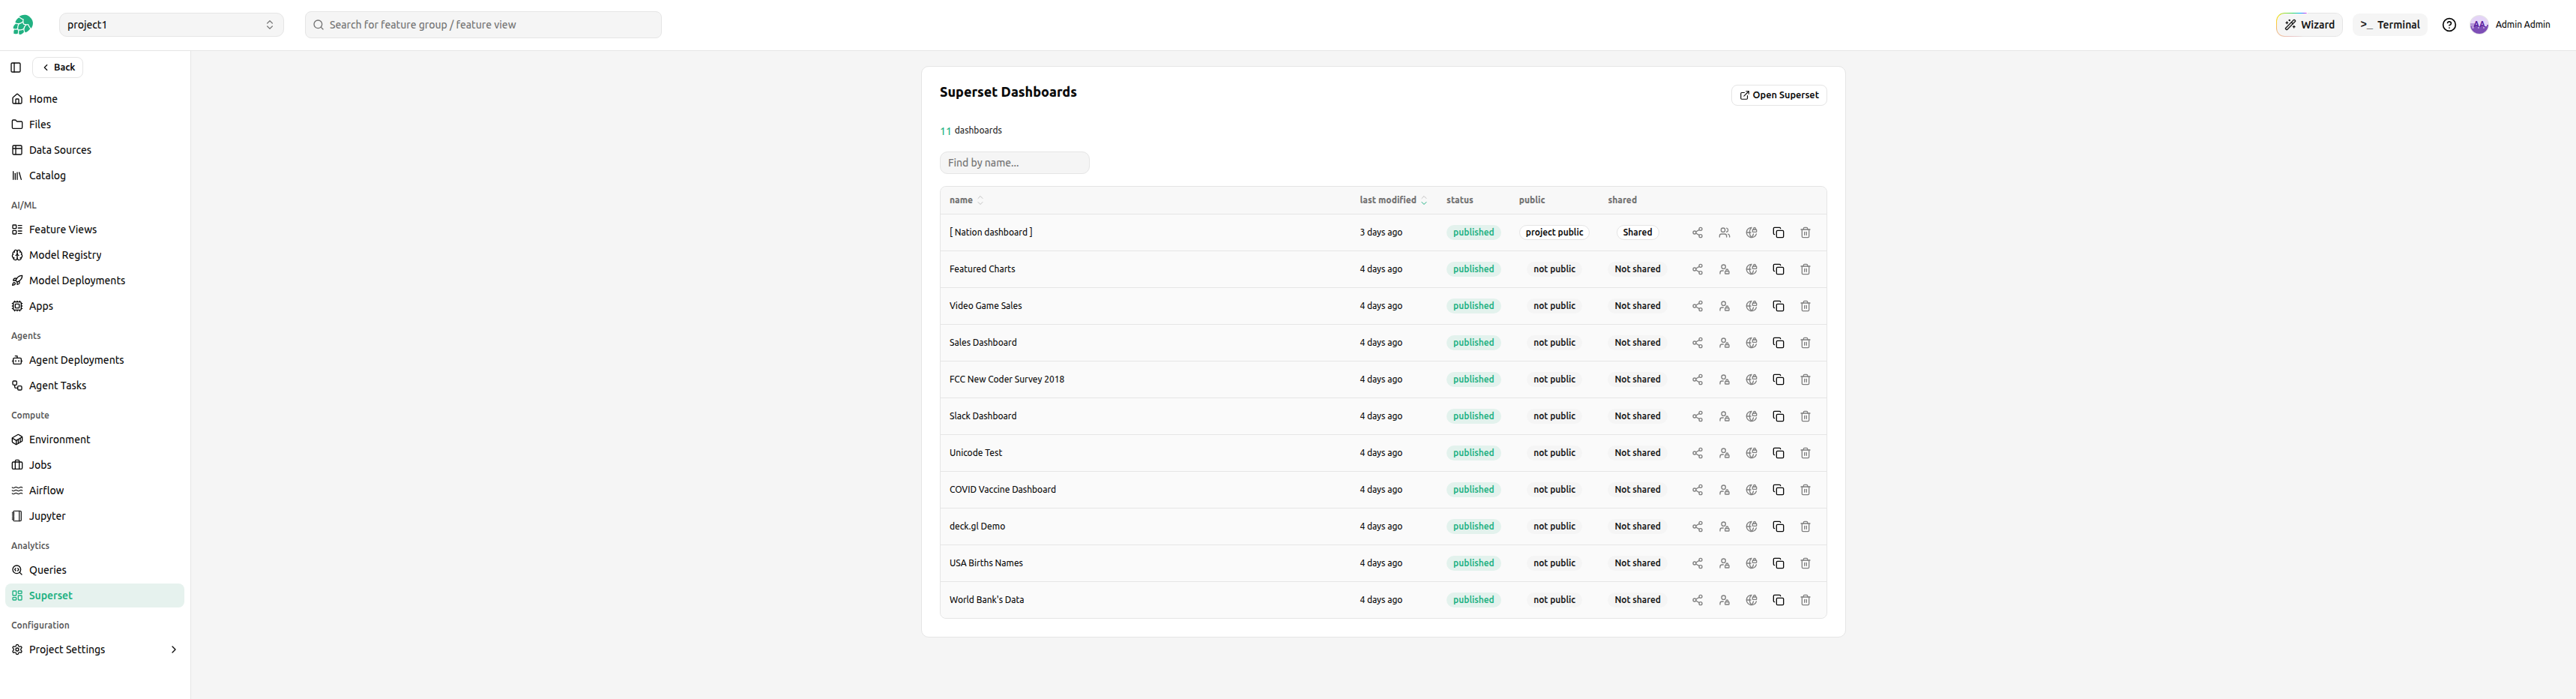
To open a specific dashboard, click its name in the list. The dashboard opens in a new browser tab.
To open the full Superset application, click Open Superset. Superset opens in a new browser tab.
Superset Interface#
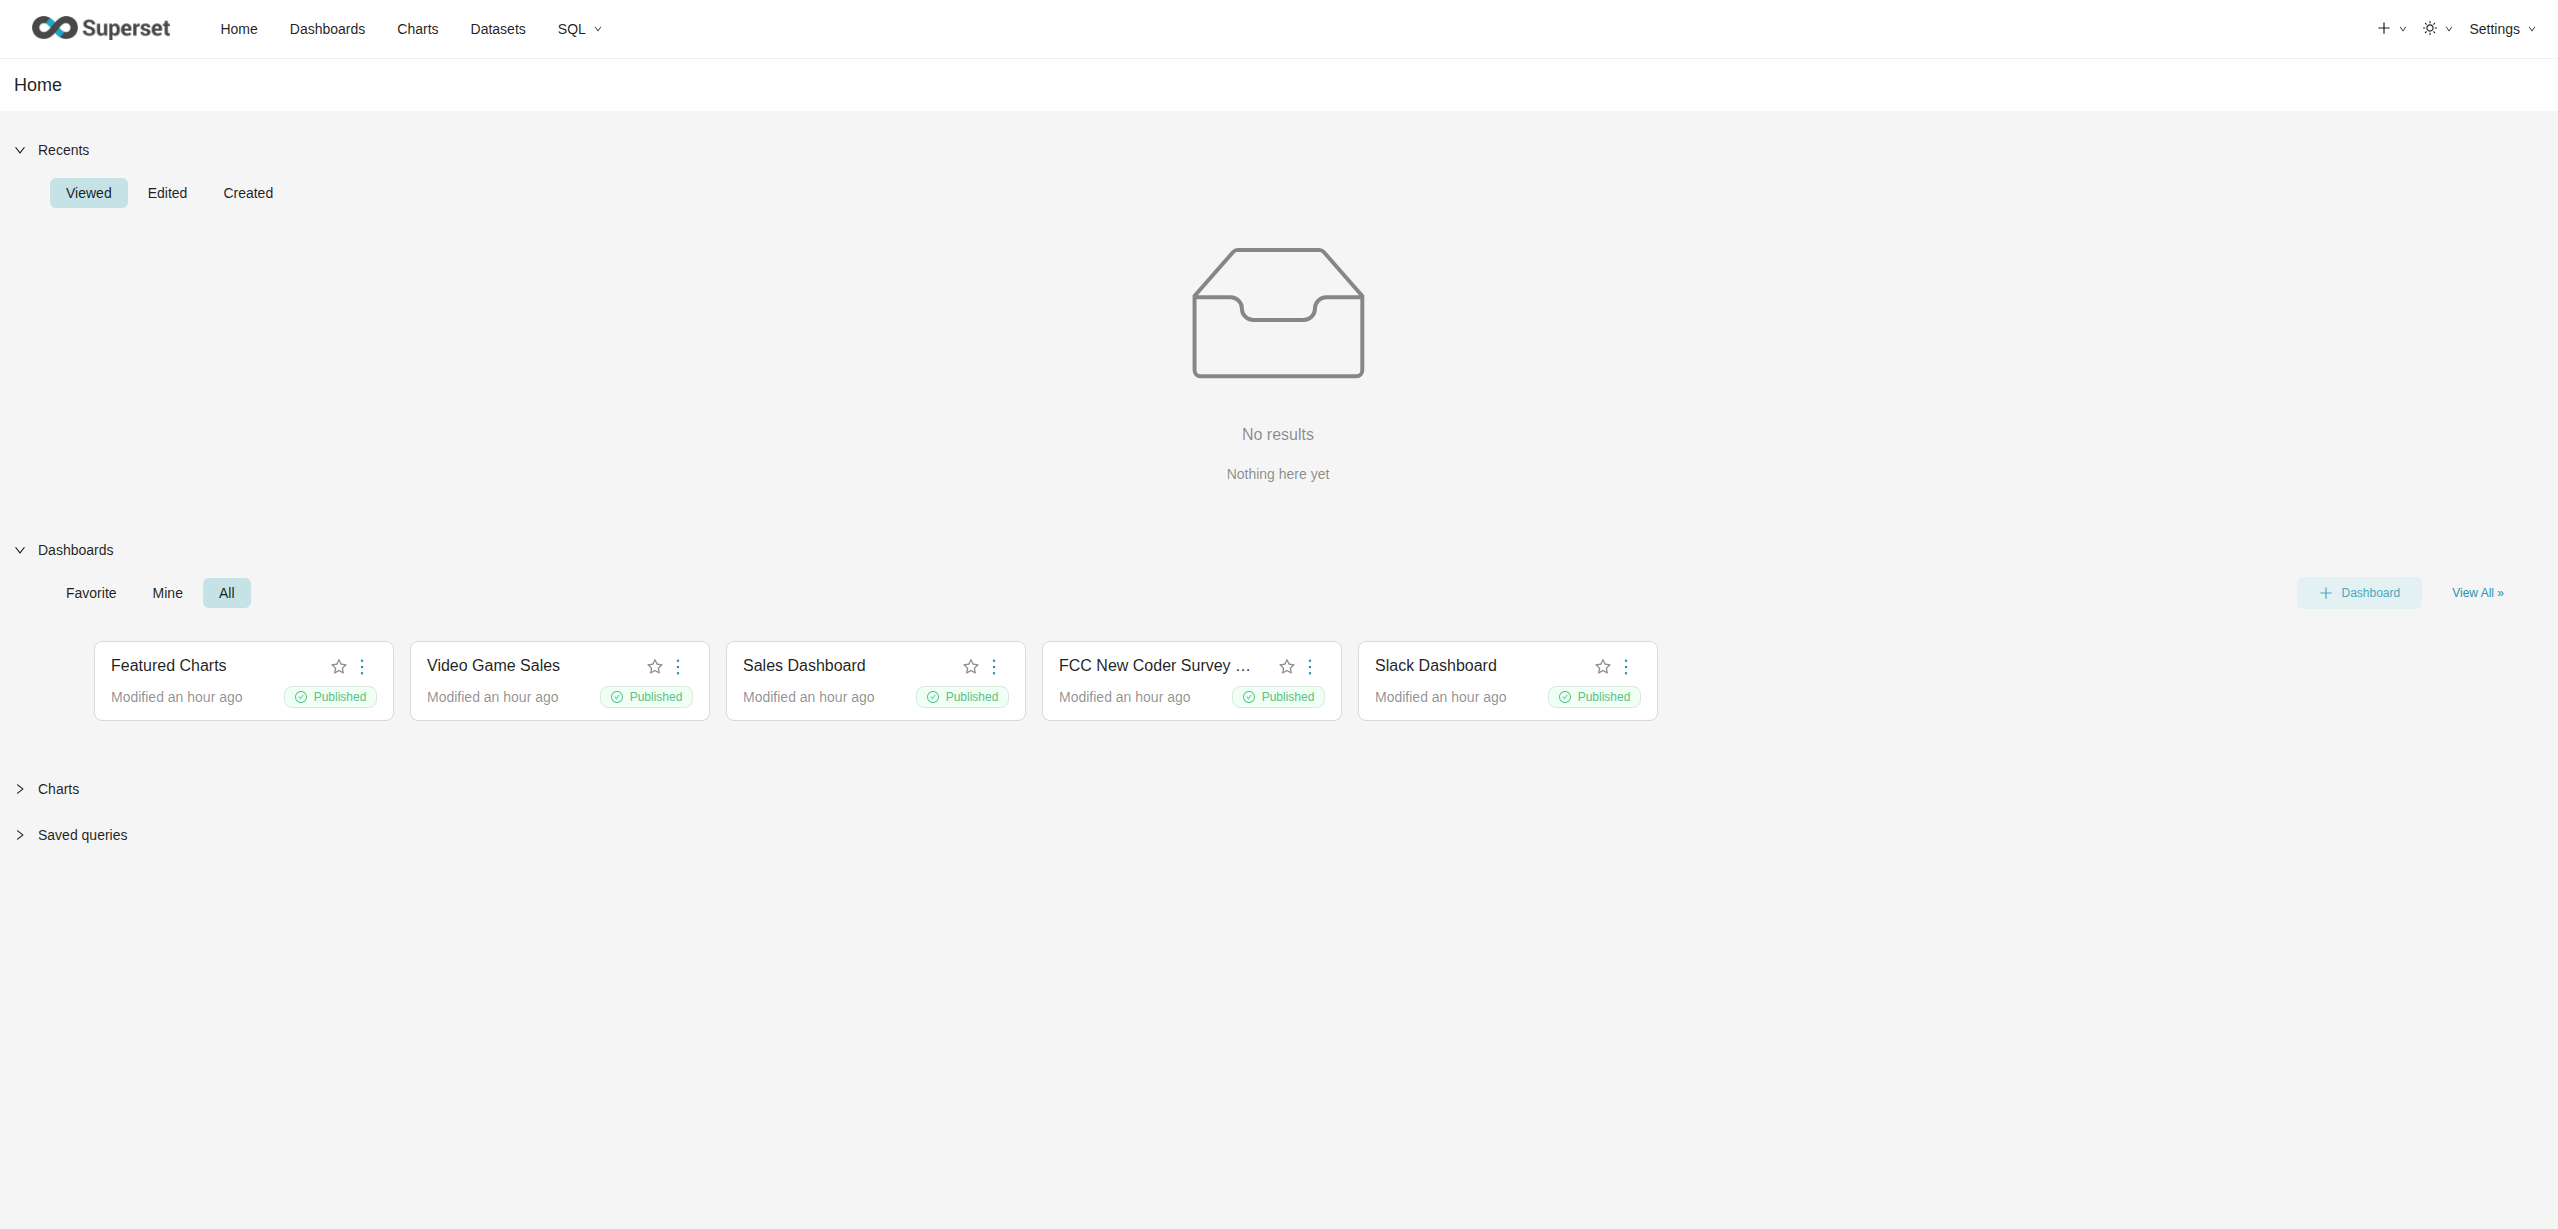
The Superset home page provides access to all major features:
Main Navigation#
- Home: Landing page with recent activity and quick access
- Dashboards: View and create interactive dashboards
- Charts: Individual visualization components
- Datasets: Configure and manage data sources from Hopsworks
- SQL: Access SQL Lab for ad-hoc queries
Recent Activity#
The home page displays your recent activity organized by:
- Viewed: Recently accessed dashboards and charts
- Edited: Items you have recently modified
- Created: Your recently created content
This provides quick access to your most frequently used visualizations.
SQL Lab#
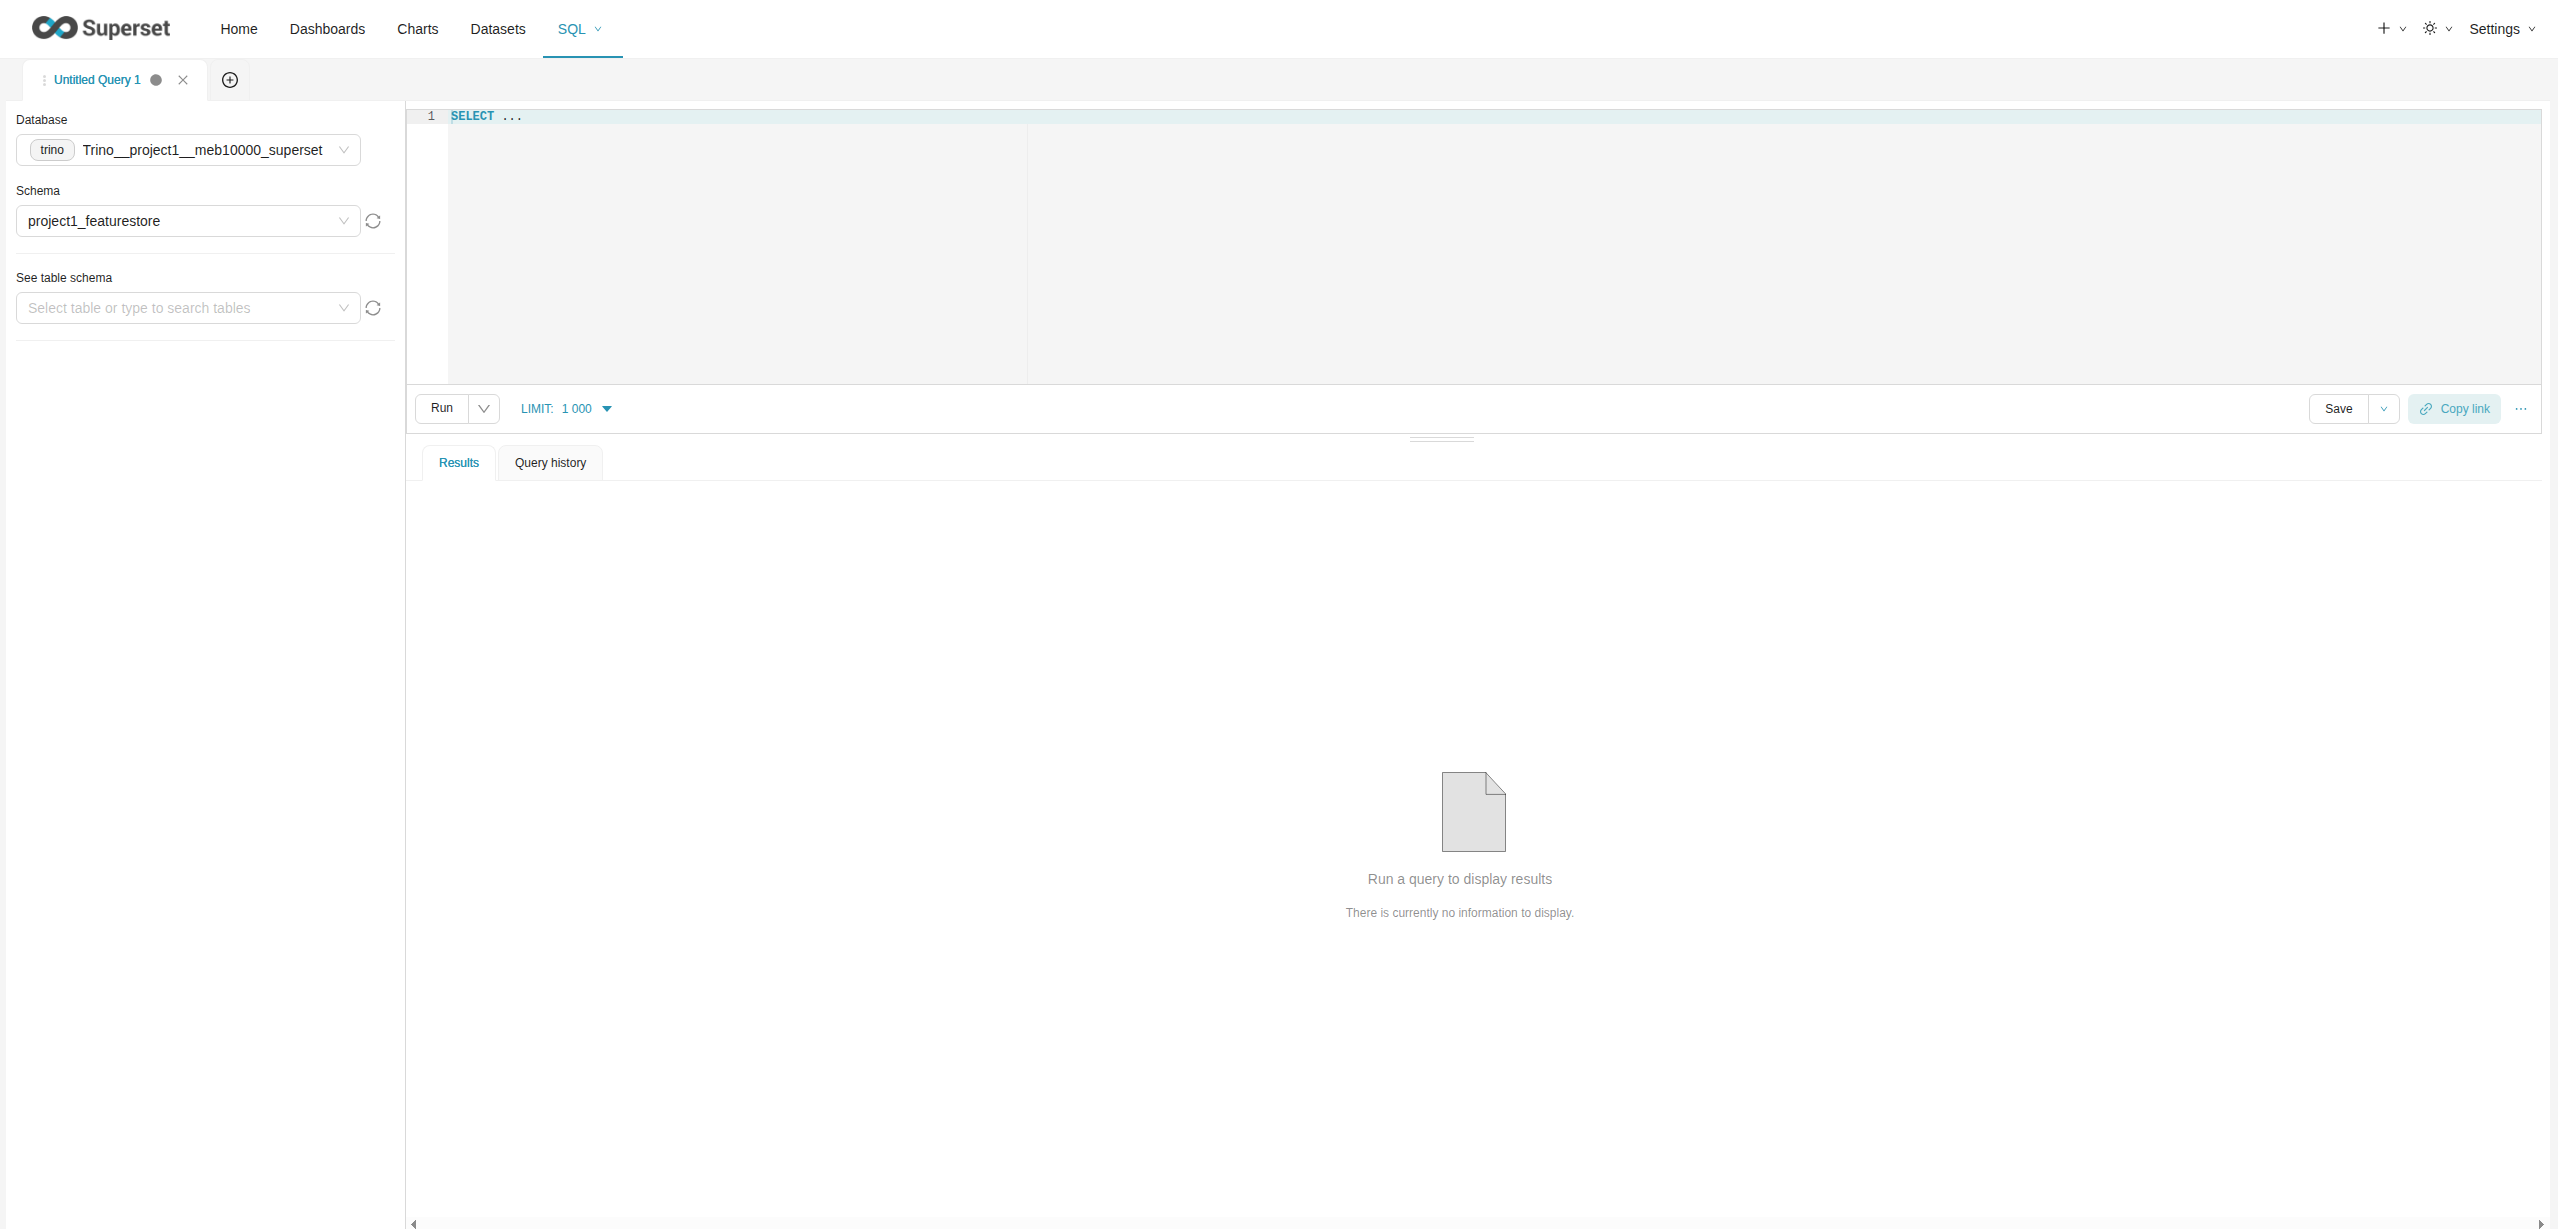
SQL Lab is an interactive SQL query interface for exploring your feature data.
Opening SQL Lab#
- Click SQL Lab in the top navigation
- Select your database from the Database dropdown
- Select your project's Feature Store schema from the Schema dropdown
Running Queries#
To execute a query:
- Type your SQL query in the editor
- Click Run or press
Ctrl+Enter(Windows/Linux) orCmd+Enter(Mac) - View results in the Results tab below the editor
- Check the Query History tab to see previous queries
Best Practices for SQL Lab#
- Limit result sets: Use
LIMITclauses to avoid retrieving excessive data - Test queries incrementally: Start with small queries and build up complexity
- Save important queries: Use the save feature for queries you'll reuse
- Use proper formatting: Format SQL for readability and maintainability
Creating Datasets#
Datasets define the data sources for your charts and dashboards. They typically map to Feature Groups in your Hopsworks project.
Adding a Dataset#
- Navigate to Datasets
- Click + Dataset in the top right
- Select your database (e.g.,
Trino__<project_name>__<username>_superset) - Select your schema (your project's Feature Store schema)
- Select the table (your Feature Group or Feature View)
- Click Create Dataset and Create Chart
Using Different Table Formats
If your Feature Store tables use a specific table format (Delta, Iceberg, or Hudi) and the Trino default catalog is not configured to match that format, you need to specify the catalog explicitly in your query.
Click Create dataset from SQL query and specify the catalog name matching your table format:
- For Delta format:
SELECT * FROM delta.<project_name>_featurestore.<table_name> - For Iceberg format:
SELECT * FROM iceberg.<project_name>_featurestore.<table_name> - For Hudi format:
SELECT * FROM hudi.<project_name>_featurestore.<table_name>
If you're unsure which format your tables use or what the default catalog is set to, contact your Hopsworks administrator.
Creating Charts#
Charts are individual visualization components that can be added to dashboards.
Creating a New Chart#
- Navigate to Charts
- Click + Chart
- Select a dataset
- Choose a visualization type (e.g., Bar Chart, Line Chart, Pie Chart, Table)
- Click Create new chart
Configuring Charts#
The chart editor provides:
- Data tab: Configure metrics, dimensions, and filters
- Customize tab: Adjust colors, labels, and styling
- Preview: Real-time preview of your chart
- Save: Save the chart for use in dashboards
Creating Dashboards#
Dashboards combine multiple charts into interactive visualization reports.
Creating a New Dashboard#
- Navigate to Dashboards
- Click + Dashboard
- Enter a dashboard name
- Click Save
Adding Charts to Dashboards#
- Open your dashboard in edit mode
- Click Edit dashboard
- Drag and drop charts from the chart list onto the dashboard
- Resize and arrange charts as needed
- Click Save to publish the dashboard
Sharing and Collaboration#
Sharing Dashboards#
By default, a dashboard is only accessible to its owner. The project's Superset page in Hopsworks lists every dashboard with two visibility columns and per-row actions for changing who can see it:
- public column:
not public,project public(visible to every member of the current project), orpublic(visible to unauthenticated viewers). - shared column:
Not shared, orShared(hover to see which other projects the dashboard is shared with).
The per-row action icons, from left to right, are: share with other projects, share with all project members, make public, copy permalink, and delete.
These sharing and visibility actions, along with delete, are available only to the dashboard's owner. Other users can still open a dashboard and copy its permalink.
All sharing actions require the dashboard to be published in Superset first. A draft is invisible to the roles being granted access, so the sharing icons stay disabled until you publish it.
You can also share with specific users or roles from Superset's native dashboard Access dialog, as described next.
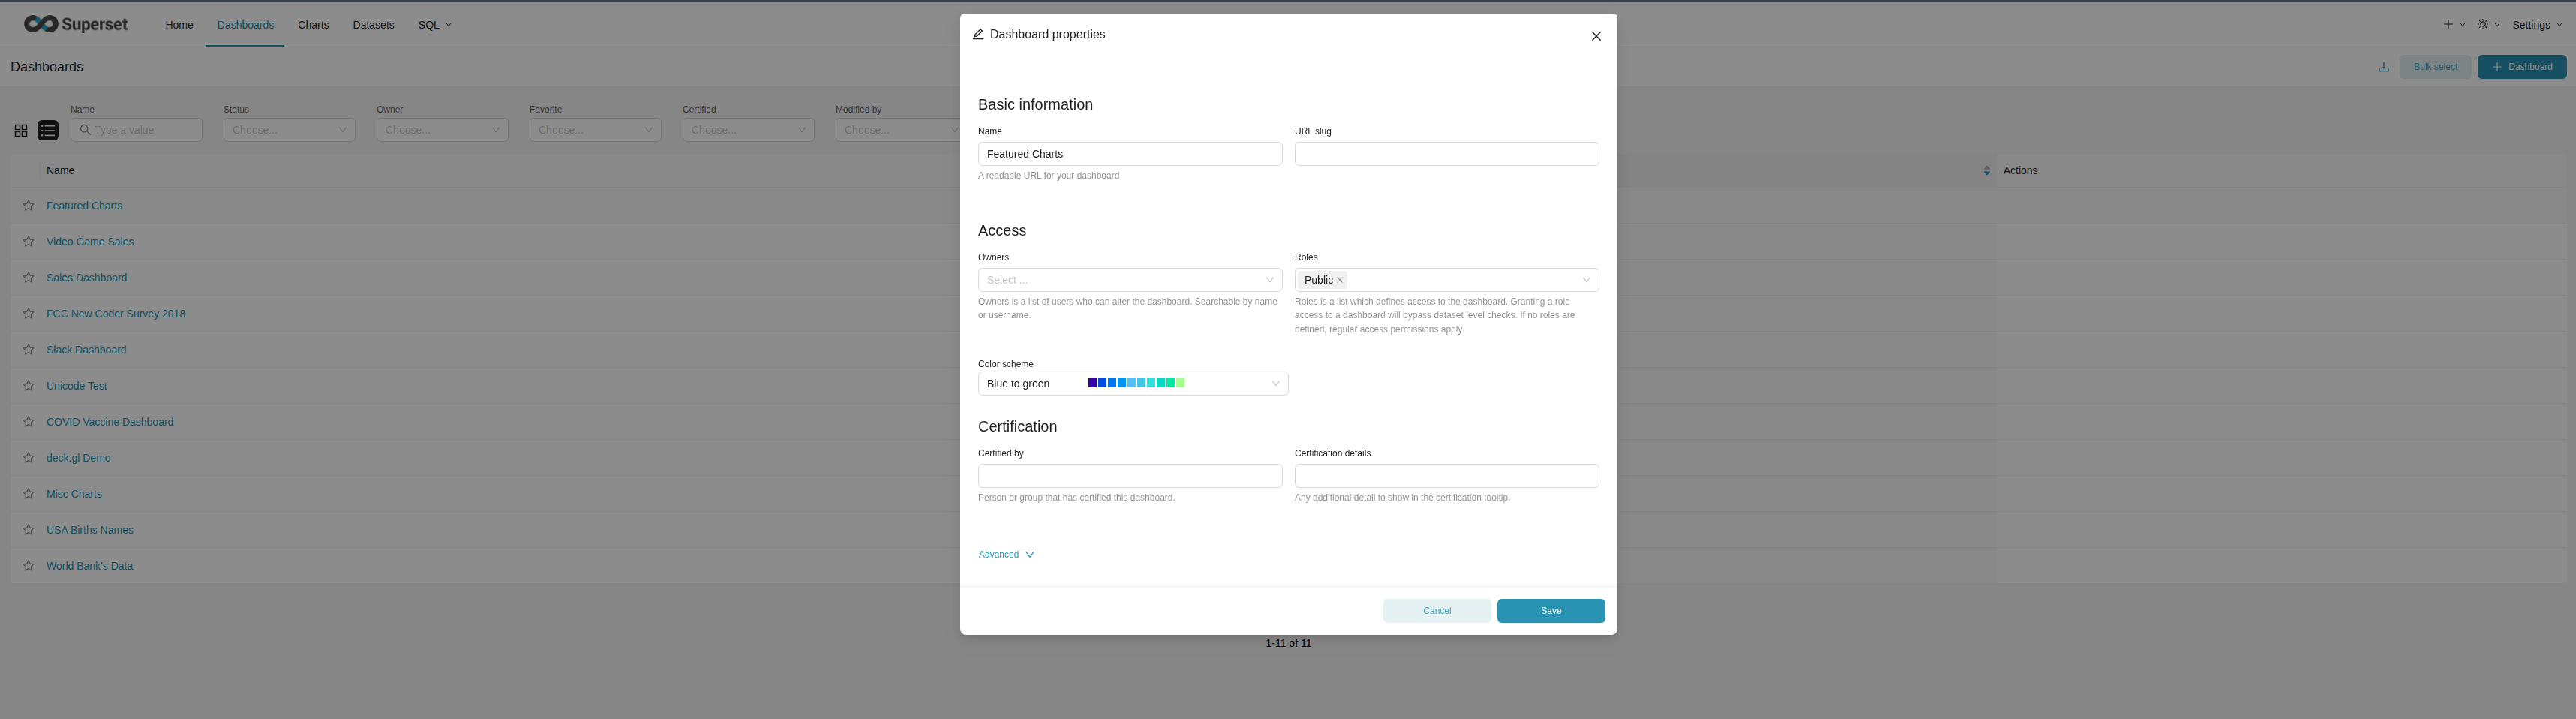
Adding Users to Share a Dashboard#
To share a dashboard with specific users or roles:
- Navigate to Dashboards and locate your dashboard
- Click the edit icon menu next to the dashboard name
- In the Access section, you can grant access in two ways:
- Owners: Add individual users to the owners list to grant them full access
- Roles: Add a role that users are members of to grant access to all users with that role
Users added as owners or through roles can view and interact with the dashboard.
Sharing with All Project Members#
To make a dashboard visible to every member of the current project, click the share with all project members icon on the dashboard's row. Hopsworks grants the project's role access to the dashboard, and the public column changes to project public. Click the icon again to remove access; the column returns to not public.
Project members can then open the dashboard from their own Superset page or through a permalink.
Sharing with Other Projects#
You can grant members of other projects access to a dashboard without making it public:
- Click the share with other projects icon on the dashboard's row
- In the Share with other projects dialog, find the target project by name
- Tick a project to share the dashboard with all of its members; untick it to stop sharing
The shared column shows Shared once at least one other project has access. Hover over it to see the list of projects.
You do not need to be a member of a project to share a dashboard with it. Sharing attaches that project's role to the dashboard, so its members can open it from their own Superset page.
Making Dashboards Public#
To make a dashboard accessible to unauthenticated viewers (anyone with the link, no Superset login), use the make public icon on the project's Superset dashboards page in Hopsworks:
- Open the Superset page in your project
- Locate the dashboard in the list
- Click the make public icon for that dashboard
The dashboard is marked public and becomes viewable without a Superset login. Click the icon again to remove public access.
The icon is enabled only when Superset's built-in Public role exists. If the role is missing, the icon is disabled and its tooltip reads The Superset Public role does not exist, and you should contact your Hopsworks administrator.
You can also add or remove the Public role from Superset's native dashboard Access dialog.
Security Considerations
Only make a dashboard public when it contains non-sensitive data. Ensure the dashboard does not expose confidential or project-specific information.
Anonymous access requirements#
Marking a dashboard public requires only the Public role to exist. For unauthenticated viewers to actually open public dashboards and permalinks, the Superset deployment must satisfy two further conditions. The dashboards page shows a warning that lists any condition that is not met:
- The built-in Public role exists. Without it, dashboards cannot be made public.
- Unauthenticated access to the dashboard list is enabled. This requires
AUTH_ROLE_PUBLIC = "Public"insuperset_config.py. - The Public role has the required permissions. Running
superset initsyncs the permissions, and the Public role must also have dataset access.
If the warning appears, contact your Hopsworks administrator to complete the configuration. See the Apache Superset public role documentation for background.
Sharing Dashboard Permalinks#
A permalink is a direct link to a dashboard that preserves the current view state, including applied filters and parameter values.
From the project's Superset dashboards page in Hopsworks, click the copy-permalink action on a dashboard to copy its permalink to your clipboard. You can then share the copied URL with other users.
To create a permalink from within Superset instead:
- Open the dashboard you want to share
- Apply any filters or configure the view as desired
- Click the Share button (share icon) in the top right of the dashboard
- Select Copy permalink to clipboard
- Share the copied URL with other users
The permalink captures:
- Current dashboard state and selected filters
- Active parameter values
- Visible chart configurations
- Dashboard layout and zoom level
Permission Requirements
For project members: Users must have access to the dashboard (either as owners or through roles) to view it via permalink.
For unauthenticated users: To share permalinks with anonymous or unauthenticated users, the dashboard must have the Public role assigned (see Making Dashboards Public above). If the Public role option is not available, contact your Hopsworks administrator to enable it.
Exporting Dashboards#
You can export dashboards for reporting or archival purposes:
- Open the dashboard
- Click the ... menu in the top right
- Select Download to export as PDF or image
- Choose your preferred format and resolution
- Save the exported file
Exported dashboards capture the current state of all charts and visualizations, making them suitable for reports, presentations, or documentation.
Working with Feature Store Data#
Querying Feature Groups#
Feature Groups are available as tables in SQL Lab:
SELECT
    feature1,
    feature2,
    COUNT(*) as count
FROM delta.<project_name>_featurestore.my_feature_group
GROUP BY feature1, feature2
ORDER BY count DESC
LIMIT 100
Joining Multiple Feature Groups#
Combine data from multiple Feature Groups:
SELECT
    fg1.user_id,
    fg1.user_features,
    fg2.transaction_features
FROM delta.<project_name>_featurestore.user_features fg1
JOIN delta.<project_name>_featurestore.transaction_features fg2
    ON fg1.user_id = fg2.user_id
WHERE fg1.created_date >= CURRENT_DATE - INTERVAL '30' DAY
LIMIT 100
Performance Tips#
Query Optimization#
- Use selective filters: Filter data as early as possible in queries
- Limit result sets: Always use
LIMITto prevent excessive data transfers - Use partition pruning: Filter on partition columns when possible to reduce the amount of data scanned
- Avoid
SELECT *: Select only the columns you need - Use statistics and compaction where applicable: Keep table metadata and file layouts optimized for faster queries
Chart Performance#
- Reduce data points: Use aggregation to reduce the number of data points
- Enable caching: Cache chart results for frequently accessed dashboards
- Set appropriate refresh intervals: Don't refresh more frequently than necessary
- Use time-based filters: Limit data to relevant time periods
Troubleshooting#
Common Issues#
Cannot see my Feature Groups:
- Verify you are connected to the correct database and schema
- Ensure you have appropriate project permissions
- Refresh the schema list if Feature Groups were recently created
Queries timing out:
- Reduce the amount of data being queried using filters
- Add
LIMITclauses to restrict result set size - Break complex queries into smaller steps
- Contact your administrator about timeout settings
Charts not loading:
- Check that the underlying dataset is still available
- Verify you have permissions to access the data source
- Refresh the page or clear browser cache
- Check query filters for errors
Dashboard filters not working:
- Ensure filters are properly connected to charts
- Verify filter types match the chart data types
- Check for filter conflicts or invalid filter combinations
Trino table type error:
trino error: TrinoExternalError(type=EXTERNAL, name=UNSUPPORTED_TABLE_TYPE,
message="Cannot query Delta Lake table '<project_name>_featurestore.<table_name>'",
query_id=20260414_155131_00049_qgyn2)
This may be triggered by:
Issue 1002 - The database returned an unexpected error.
- This error occurs when querying tables without specifying the catalog name
- Your Feature Store tables use a specific format (Delta, Iceberg, or Hudi) that requires an explicit catalog prefix
- Solution: Specify the catalog name in your query (e.g.,
delta.<project_name>_featurestore.<table_name>) - See Using Different Table Formats for detailed instructions on creating datasets with the correct catalog prefix
- If you're unsure which catalog to use, contact your Hopsworks administrator
Best Practices#
Organizing Content#
- Use descriptive names: Name dashboards and charts clearly
- Tag and categorize: Use tags to organize related content
- Create folders: Group related dashboards together
- Document dashboards: Add descriptions explaining the purpose and key metrics
Performance#
- Keep queries simple: Complex queries should be tested in SQL Lab first
- Use appropriate chart types: Choose visualizations that match your data
- Limit dashboard size: Too many charts can slow down loading
- Schedule refreshes: Use automated refresh during off-peak hours
Data Quality#
- Validate queries: Test queries thoroughly before creating charts
- Handle null values: Account for missing data in visualizations
- Use appropriate aggregations: Choose meaningful aggregation functions
- Document data sources: Note which Feature Groups are used in each dashboard
Security#
- Respect data privacy: Only share dashboards with authorized project members
- Avoid sensitive data in names: Don't include sensitive information in dashboard titles
- Regular reviews: Periodically review and clean up unused dashboards
- Follow project policies: Adhere to your organization's data governance policies