Query Engine (Trino)#
The Query Engine in Hopsworks is powered by Trino, a distributed SQL query engine that allows you to run interactive analytics on your data. Use it to explore feature groups, run ad-hoc queries, and analyze data across your project.
Accessing the Query Engine#
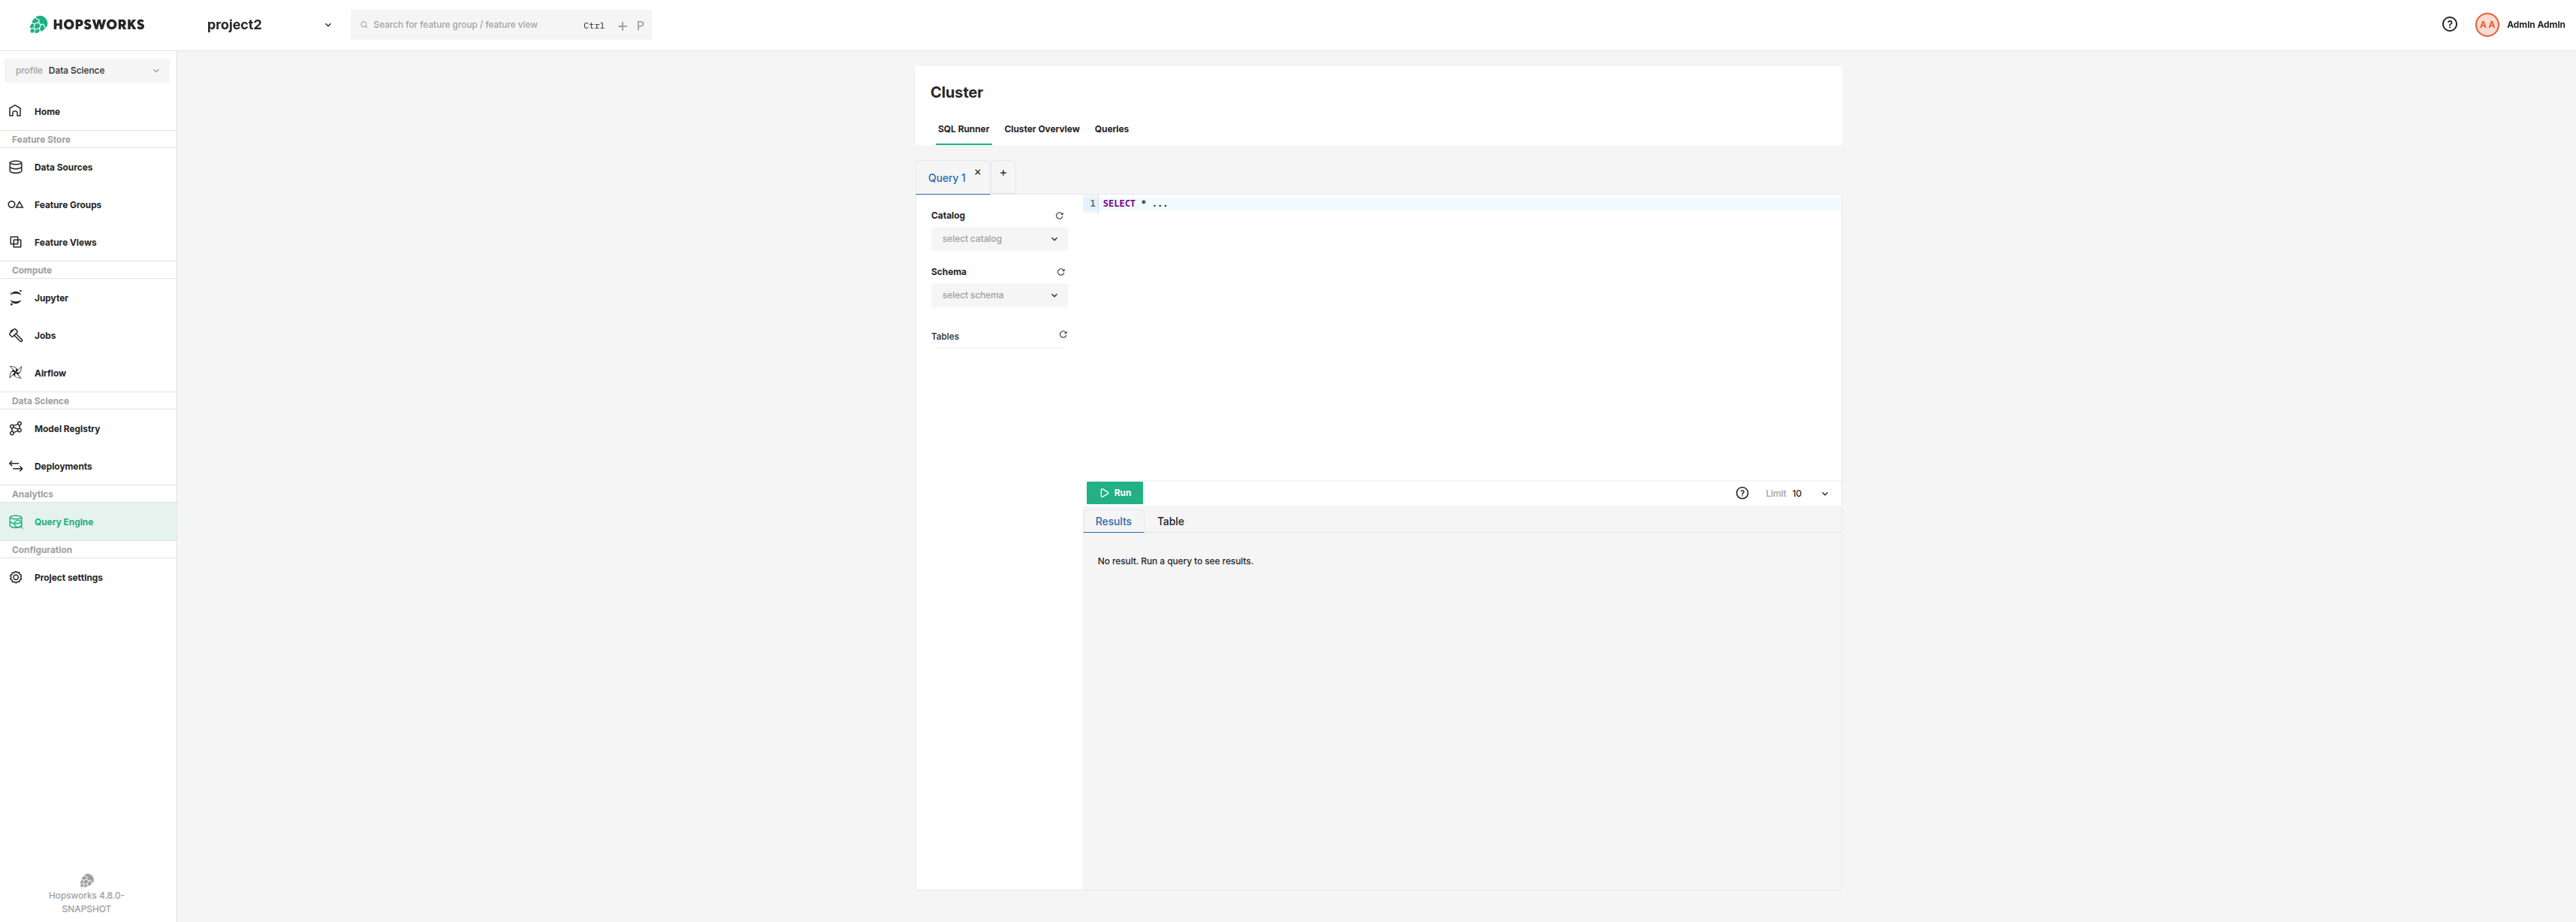
Open Queries under Analytics in your project's left sidebar. The page carries four tabs: SQL Runner, Cluster Overview, Catalogs and Queries.
SQL Runner#
The SQL runner is where you write and execute SQL queries against your data.
To run a query:
- Pick a Catalog and a Schema in the Explorer. The tables in that schema are then listed below, and you can write the query against bare table names instead of qualifying every one.
- Write the query in the editor, or click a table to start from
SELECT * FROM <table>. - Choose a row limit, which is appended to the query as a
LIMIT. - Click Run query, or press
Ctrl/Cmd + Enter.
The results appear below the editor, with each column's type under its name. The header reports the state of the run, how long it took, how many rows it processed and how many it returned. The editor auto-completes catalogs, schemas, tables and columns with Ctrl + Space, and Add query opens a second tab so several queries can be kept side by side.
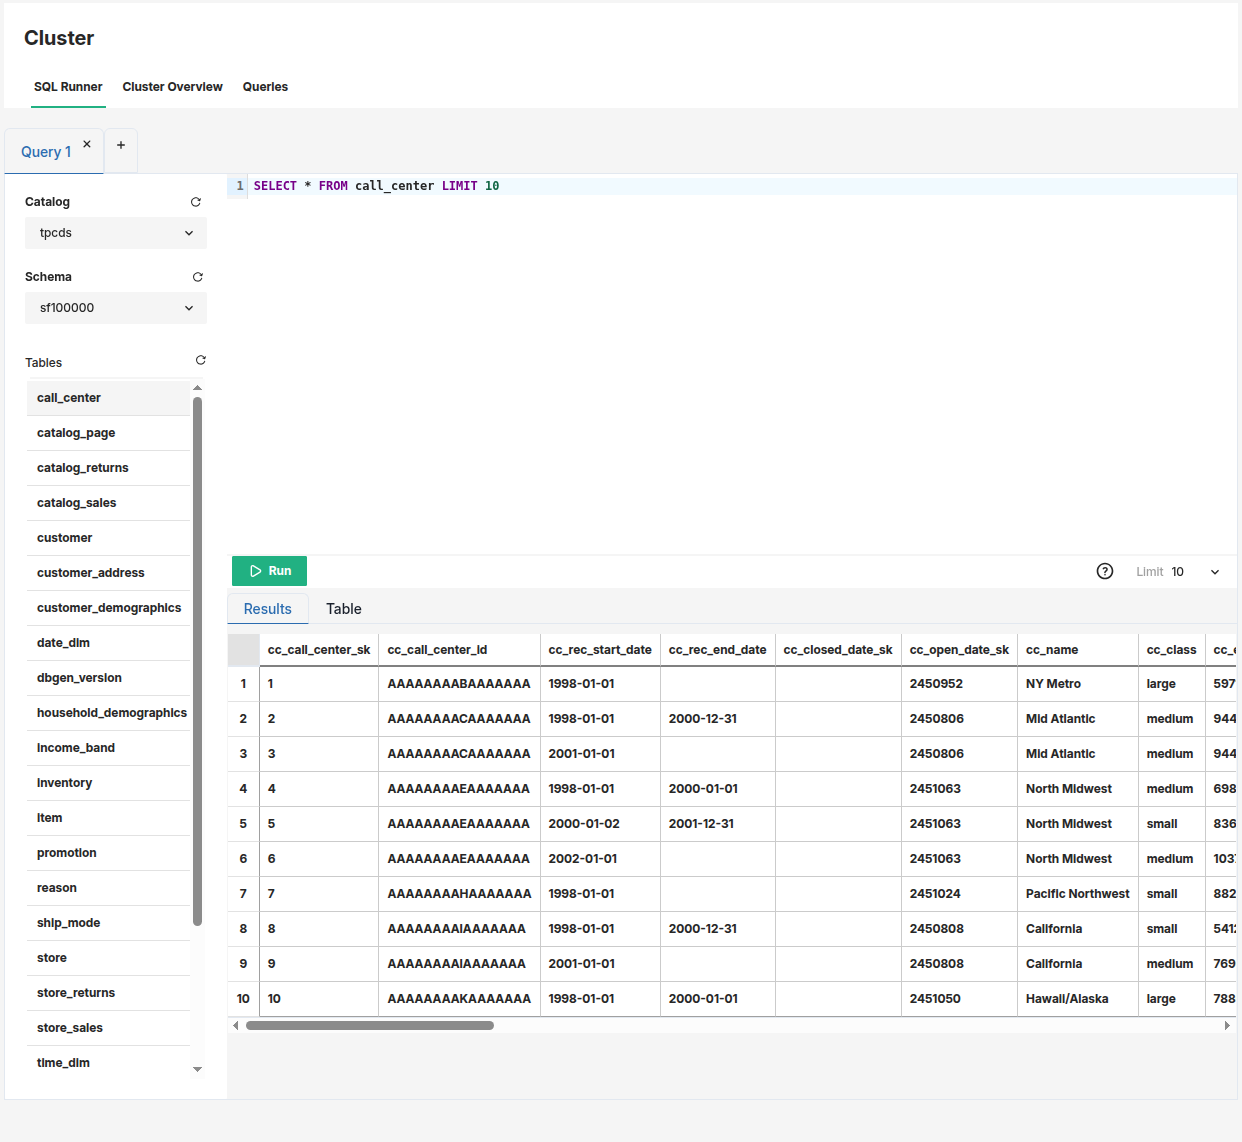
The expand icon in the results header opens the results in a full-size dialog, with the same run status, so a wide table can be read without scrolling sideways.
Statements#
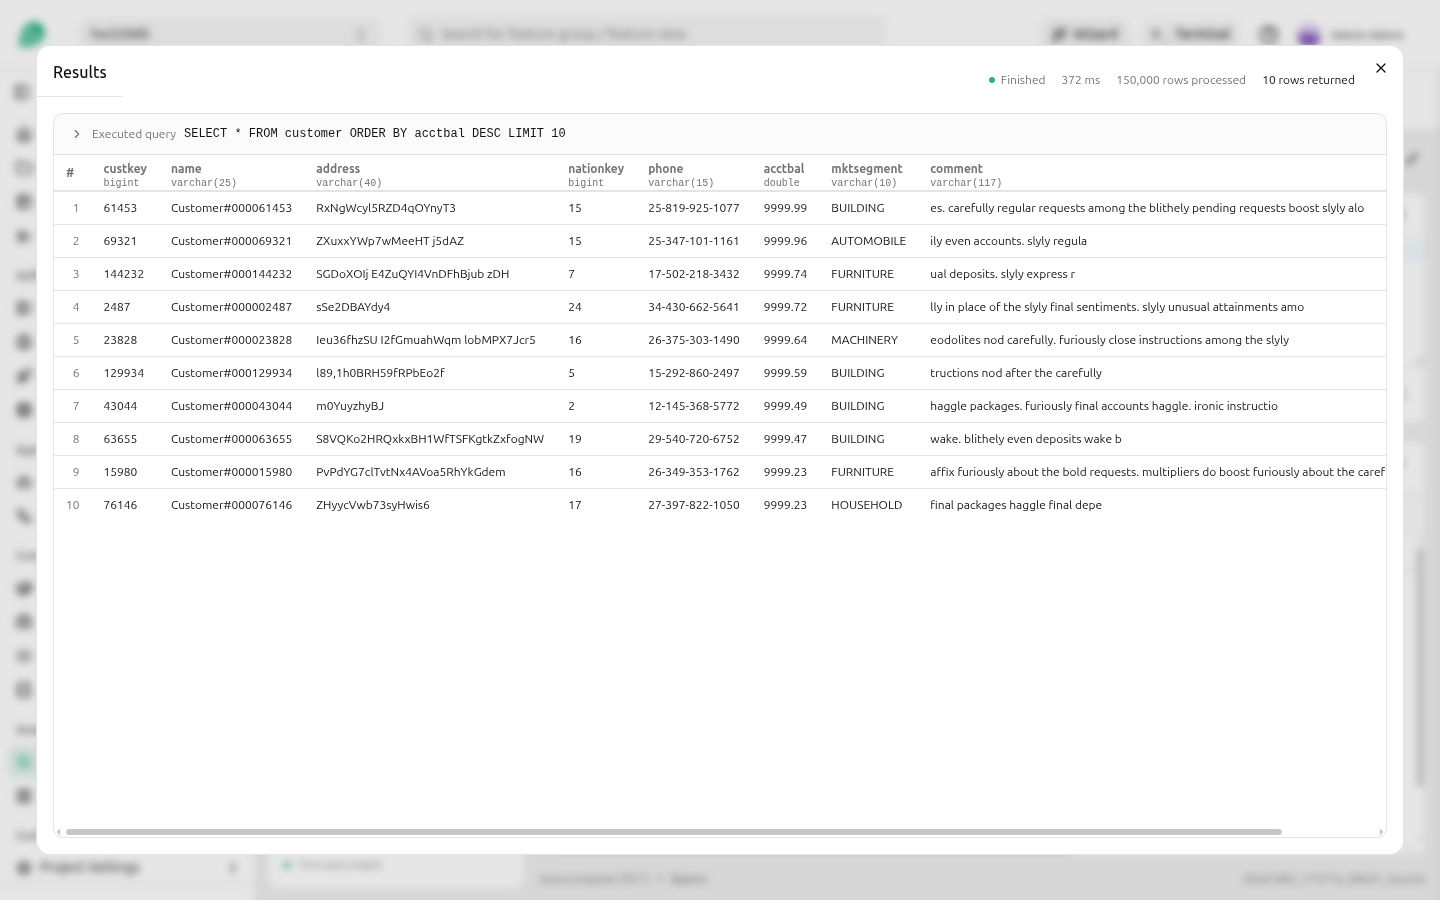
The SQL runner runs one statement at a time, and a trailing semicolon is removed before the statement is sent. A statement that changes data or the catalog reports what it did instead of a table of results: CREATE TABLE succeeded, or for INSERT, UPDATE, DELETE, MERGE and CREATE TABLE ... AS SELECT the number of rows it wrote, such as INSERT succeeded (2 rows).
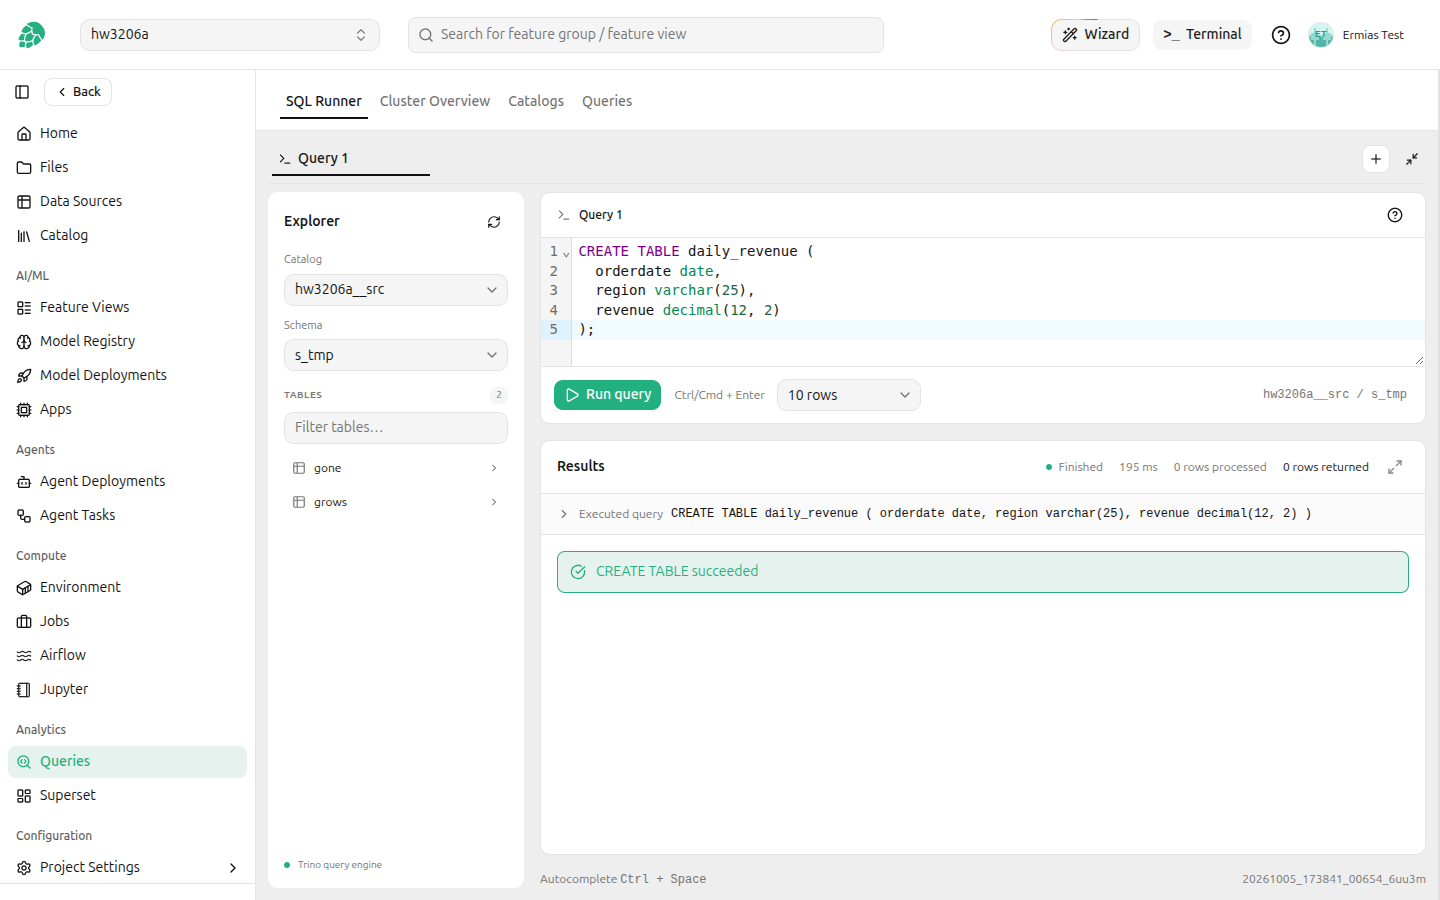
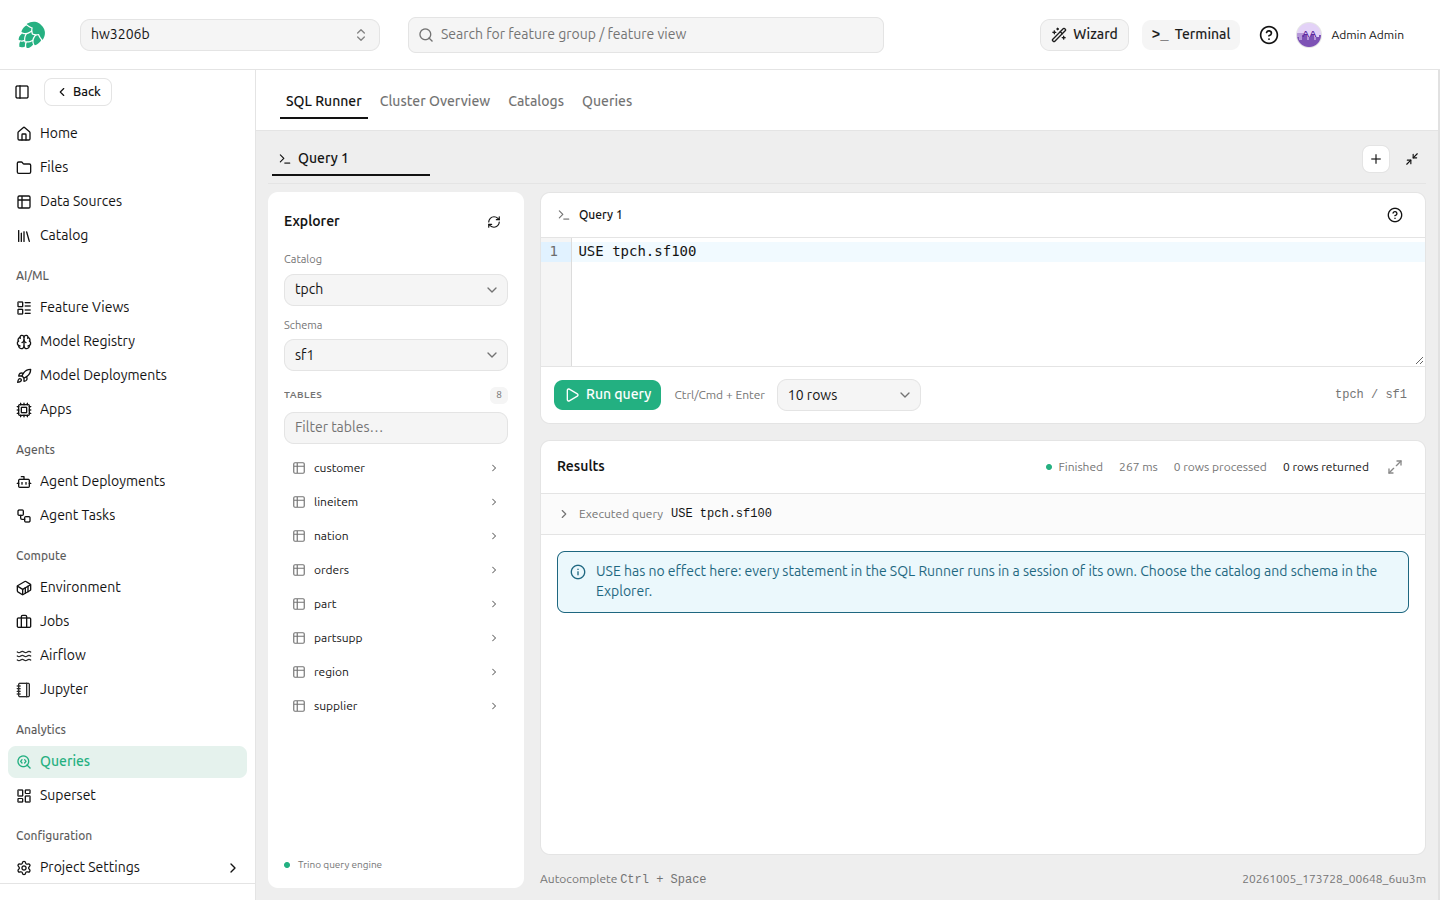
Every statement runs in a session of its own. Statements that only change the session (USE, SET SESSION, RESET SESSION, SET ROLE, SET PATH, SET TIME ZONE, PREPARE, DEALLOCATE, and the transaction statements) therefore succeed and change nothing for the next statement, and the SQL runner says so. Choose the catalog and schema in the Explorer instead of with USE.
Records#
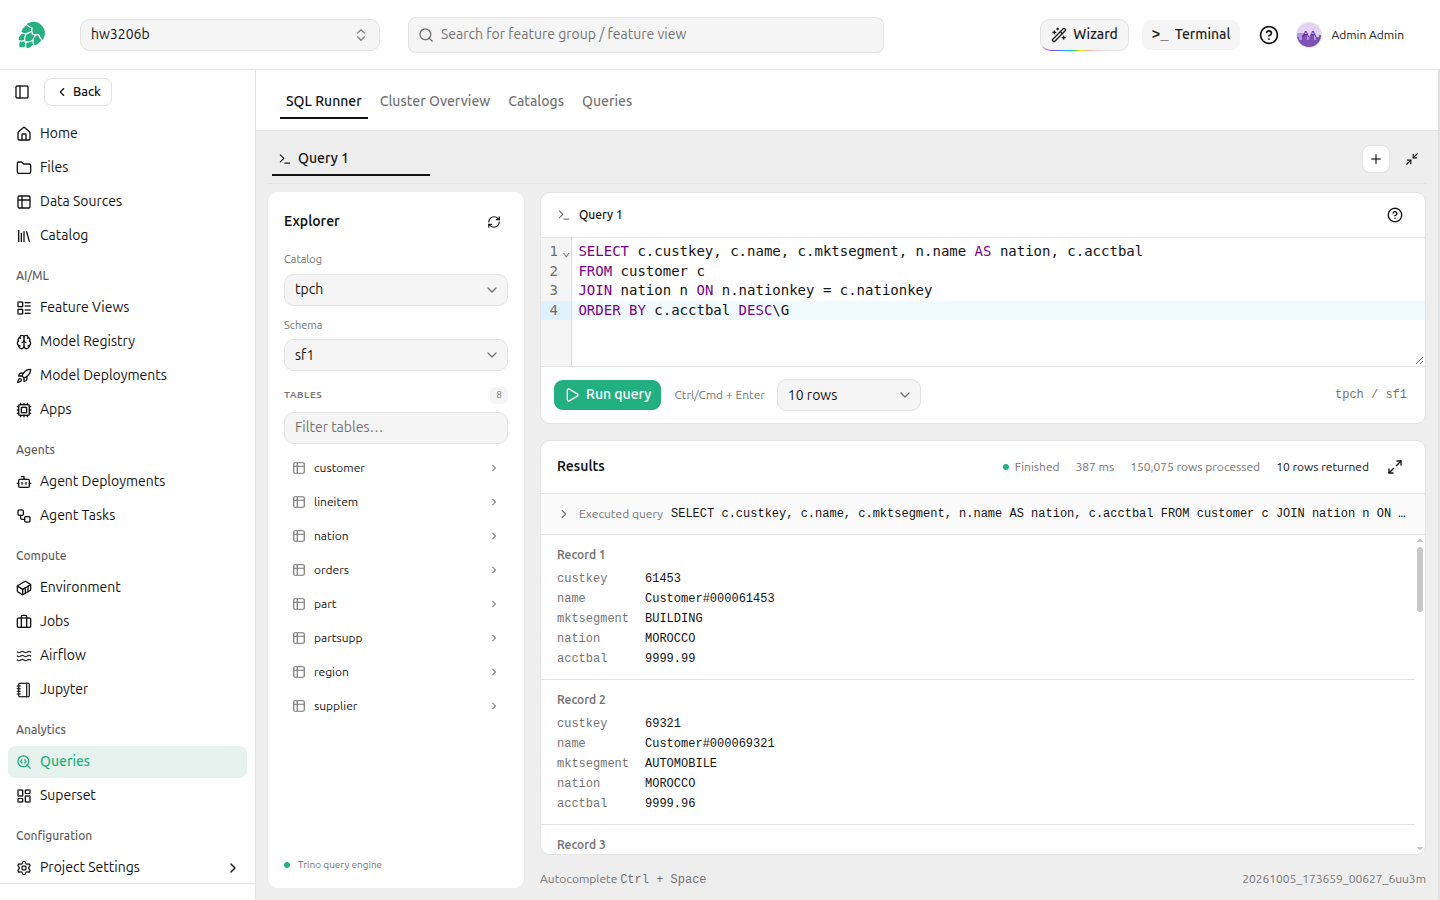
End a statement with \G instead of ; to see each row as a record, one column and value per line, the way the Trino CLI prints it. \G is not SQL: like a trailing semicolon, it is removed before the statement is sent. Records suit wide rows and long values; the records view shows the first 200 rows, so end the statement with ; to see more in the grid.
Query plans#
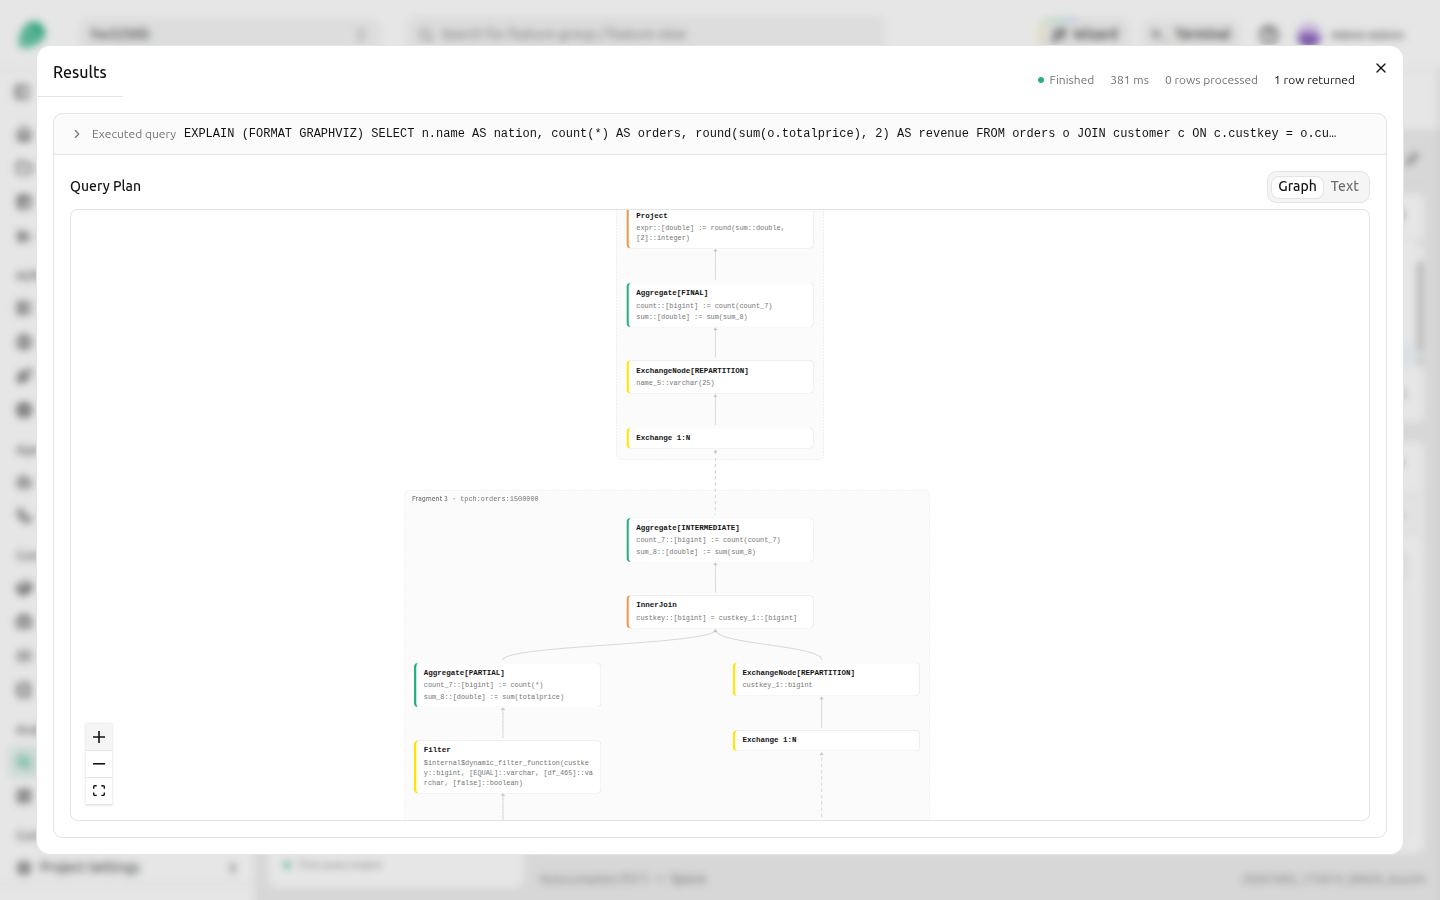
EXPLAIN shows the plan Trino would run for a statement. A plain EXPLAIN shows the plan as text, the way Trino prints it. EXPLAIN (FORMAT GRAPHVIZ) opens on a Graph view that draws the operators and the data flowing between them, grouped by fragment, which can be zoomed and moved around; Text beside it shows the Graphviz source. EXPLAIN (FORMAT JSON) and EXPLAIN (TYPE IO) are shown as indented JSON.
SQL Statement Syntax Help#
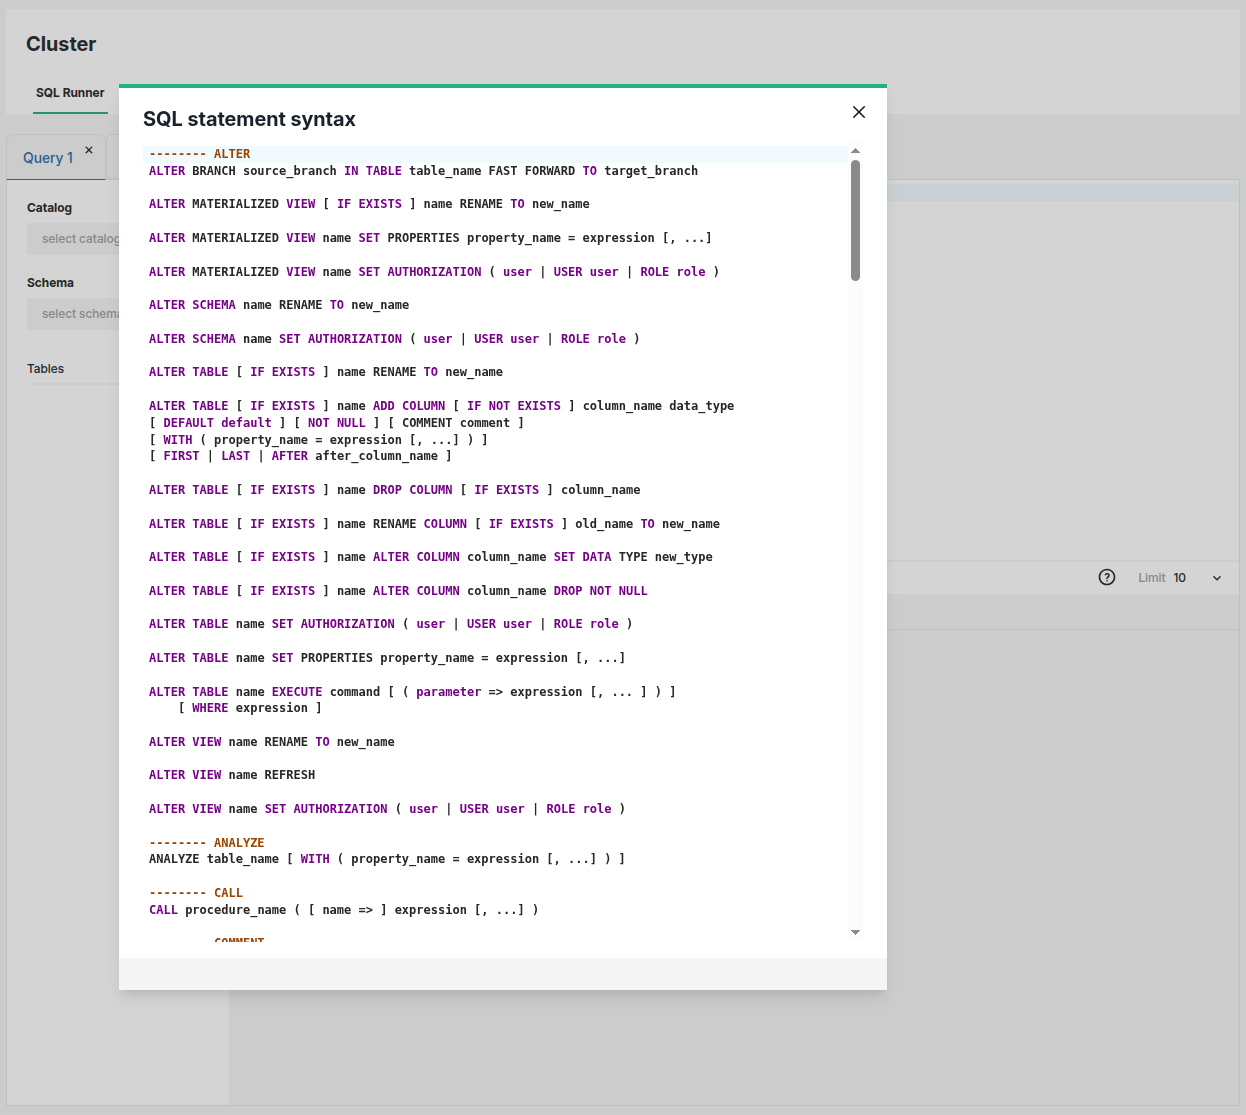
The help icon in the editor opens the syntax of every SQL statement Trino supports, from ALTER to VALUES, including the clauses of SELECT such as time travel with FOR TIMESTAMP | VERSION AS OF, TABLESAMPLE, UNNEST and JSON_TABLE. It also lists the keyboard shortcuts and the statements that have no effect in the SQL runner.
Cluster Overview#
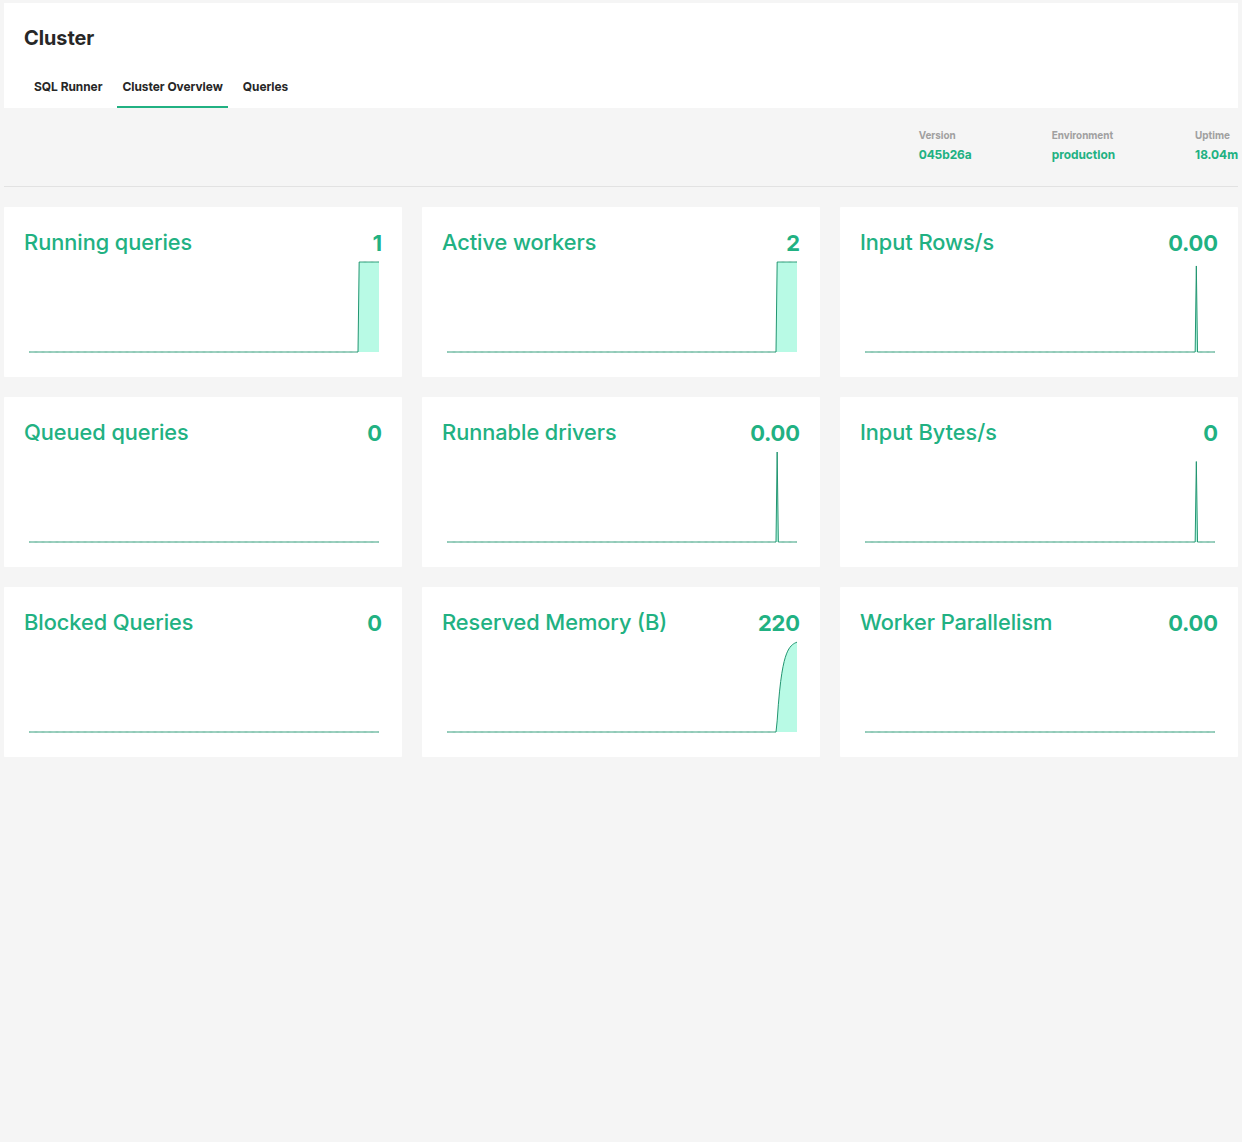
The cluster overview reports the query engine's version, environment and uptime, then a tile per metric, each with a sparkline of its recent history:
- Running queries, Queued queries and Blocked Queries
- Active workers and Worker Parallelism
- Runnable drivers, Input Rows/s and Input Bytes/s
- Reserved Memory
Together they say whether the cluster is busy and whether a slow query is competing for capacity.
Managing Catalogs#
The Catalogs tab is where a project makes an external data source queryable from the SQL runner. Creating a catalog from a data source or by hand, referencing credentials, testing the connection, and when a change reaches the query engine are all covered in Trino Catalogs.
Queries#
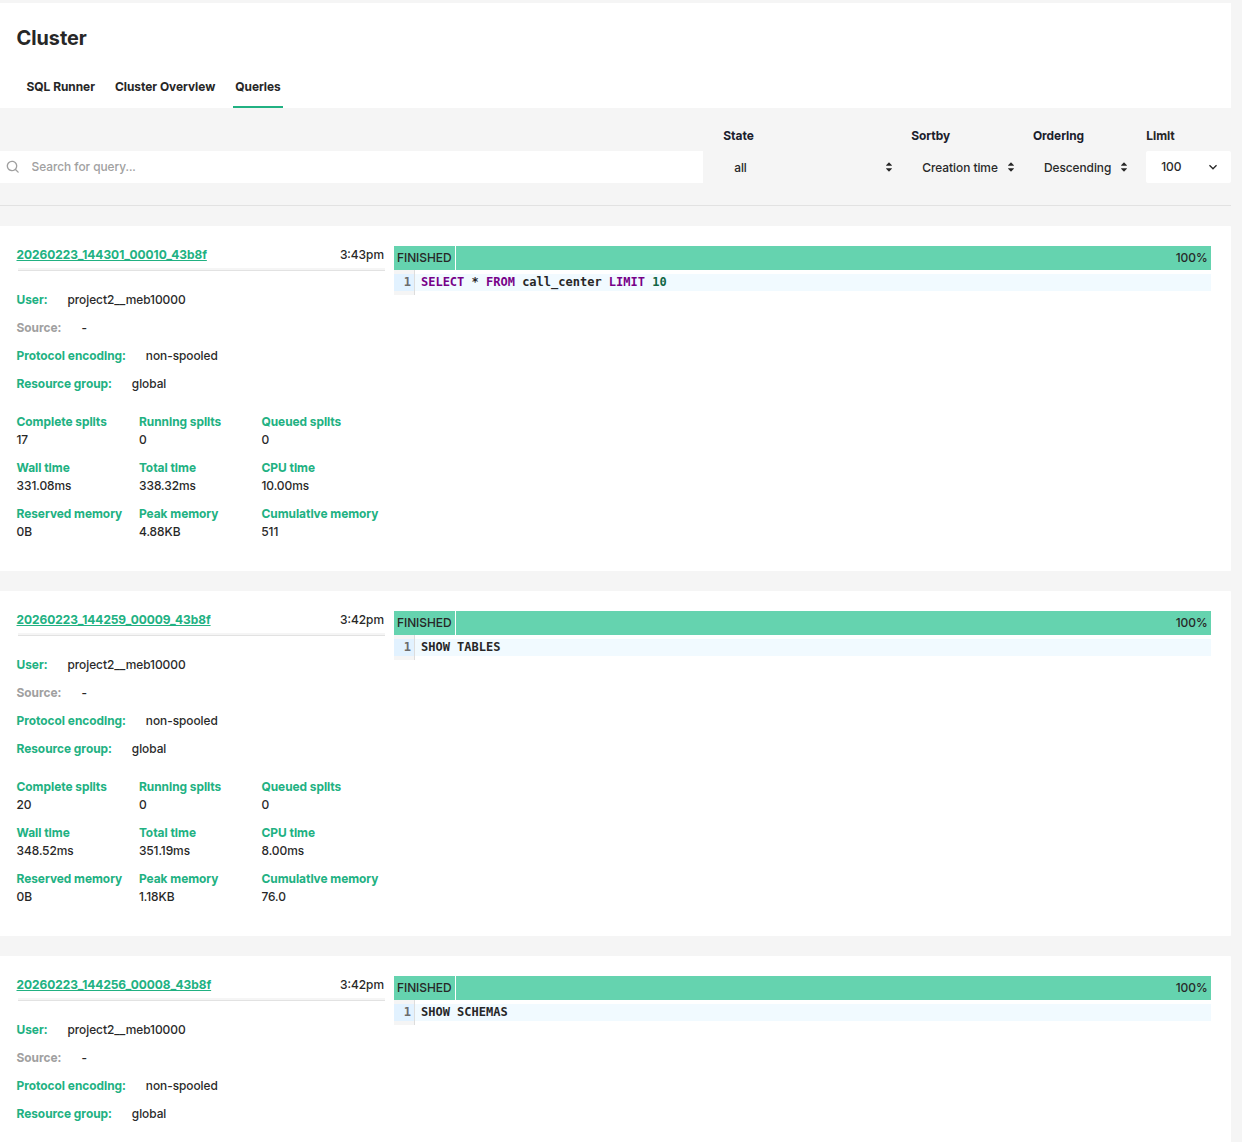
The Queries tab lists the queries the project has run, filterable by state and sortable, with the query text alongside each entry. A card carries its id and state with a progress bar, the user and source that submitted it, the resource group, its split counts, wall, total and CPU time, and its reserved, peak and cumulative memory. A query that is still running is listed the same way and updates in place.
Click a query id to open its details.
Query Details#
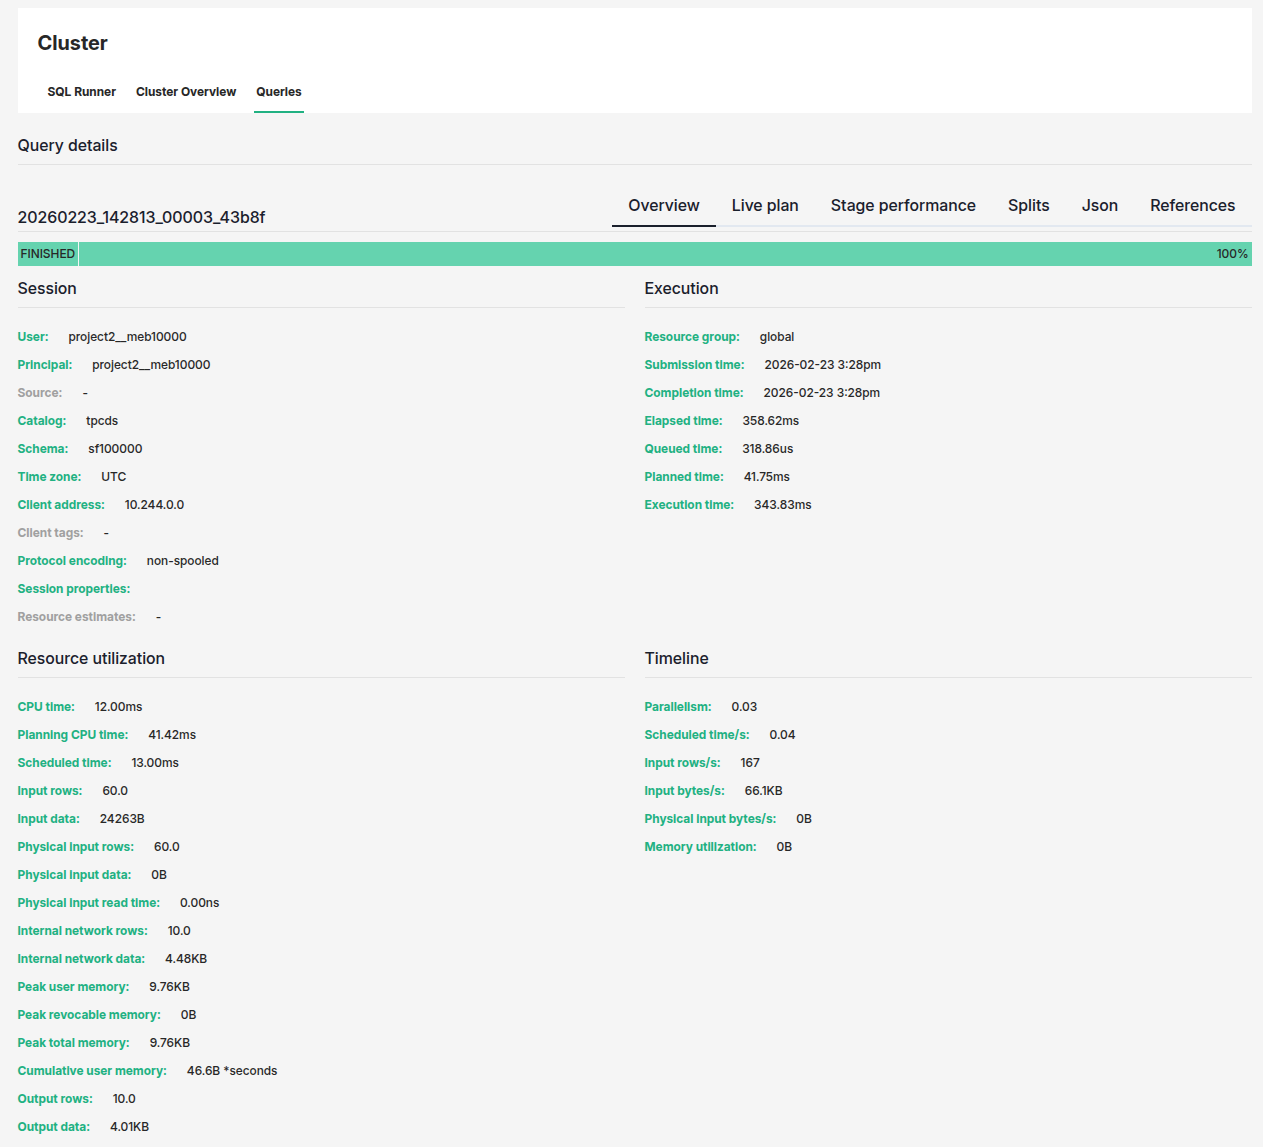
Clicking on a query opens the detailed view with comprehensive execution information.
Overview#
The overview tab shows query metadata, execution timeline, and performance metrics including:
- Query text
- Execution time
- Data processed
- Rows returned
- Resource consumption
Live Plan#
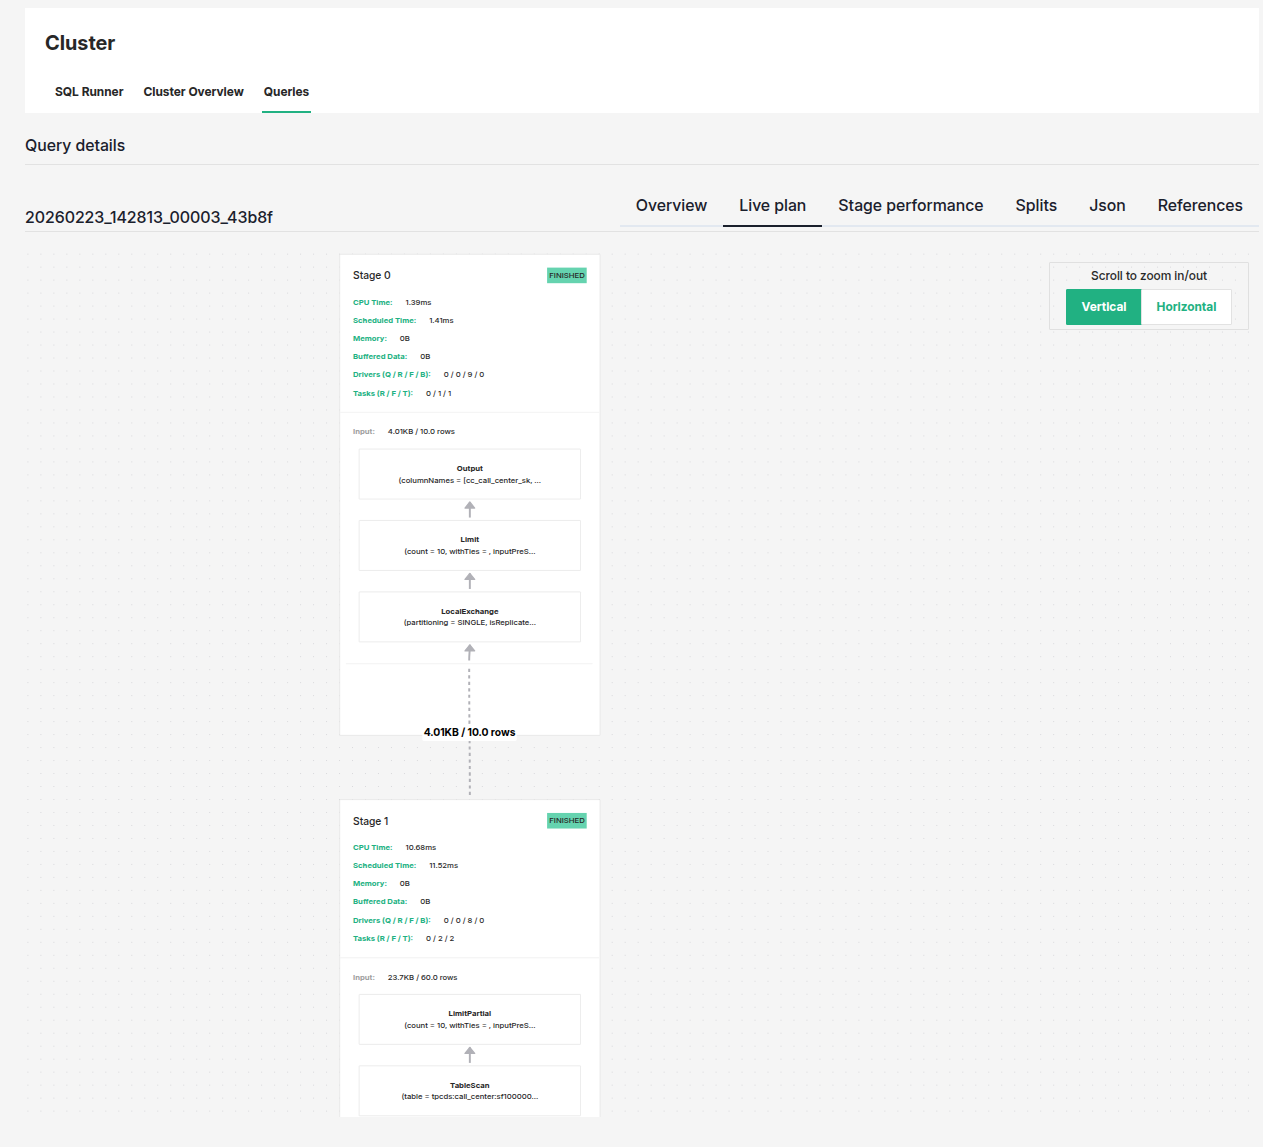
The live plan draws the query's stages and the operators inside them, with each stage's state and its CPU time, memory, drivers and tasks, updating while the query runs. The graph is usually taller than the page, so it can be laid out Vertical or Horizontal, panned by dragging, and zoomed by scrolling.
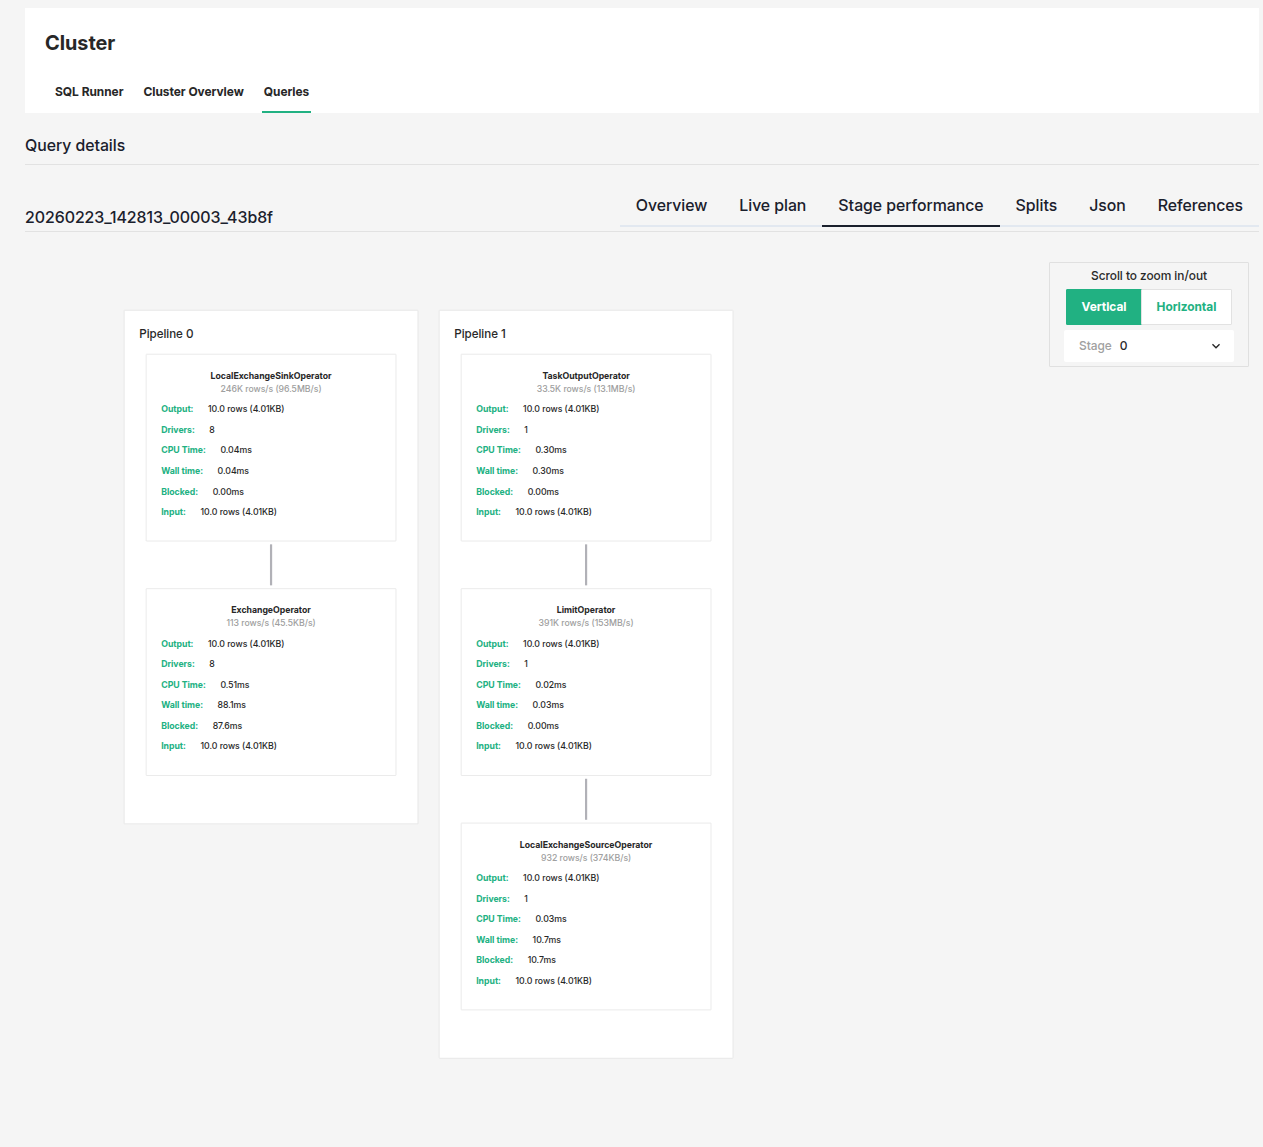
Stage performance#
This view takes one stage at a time, chosen with the Stage selector, and draws its pipelines operator by operator. Each operator reports its throughput, output rows and bytes, driver count, and CPU, wall and blocked time, which is what locates a bottleneck inside a stage rather than merely between stages.
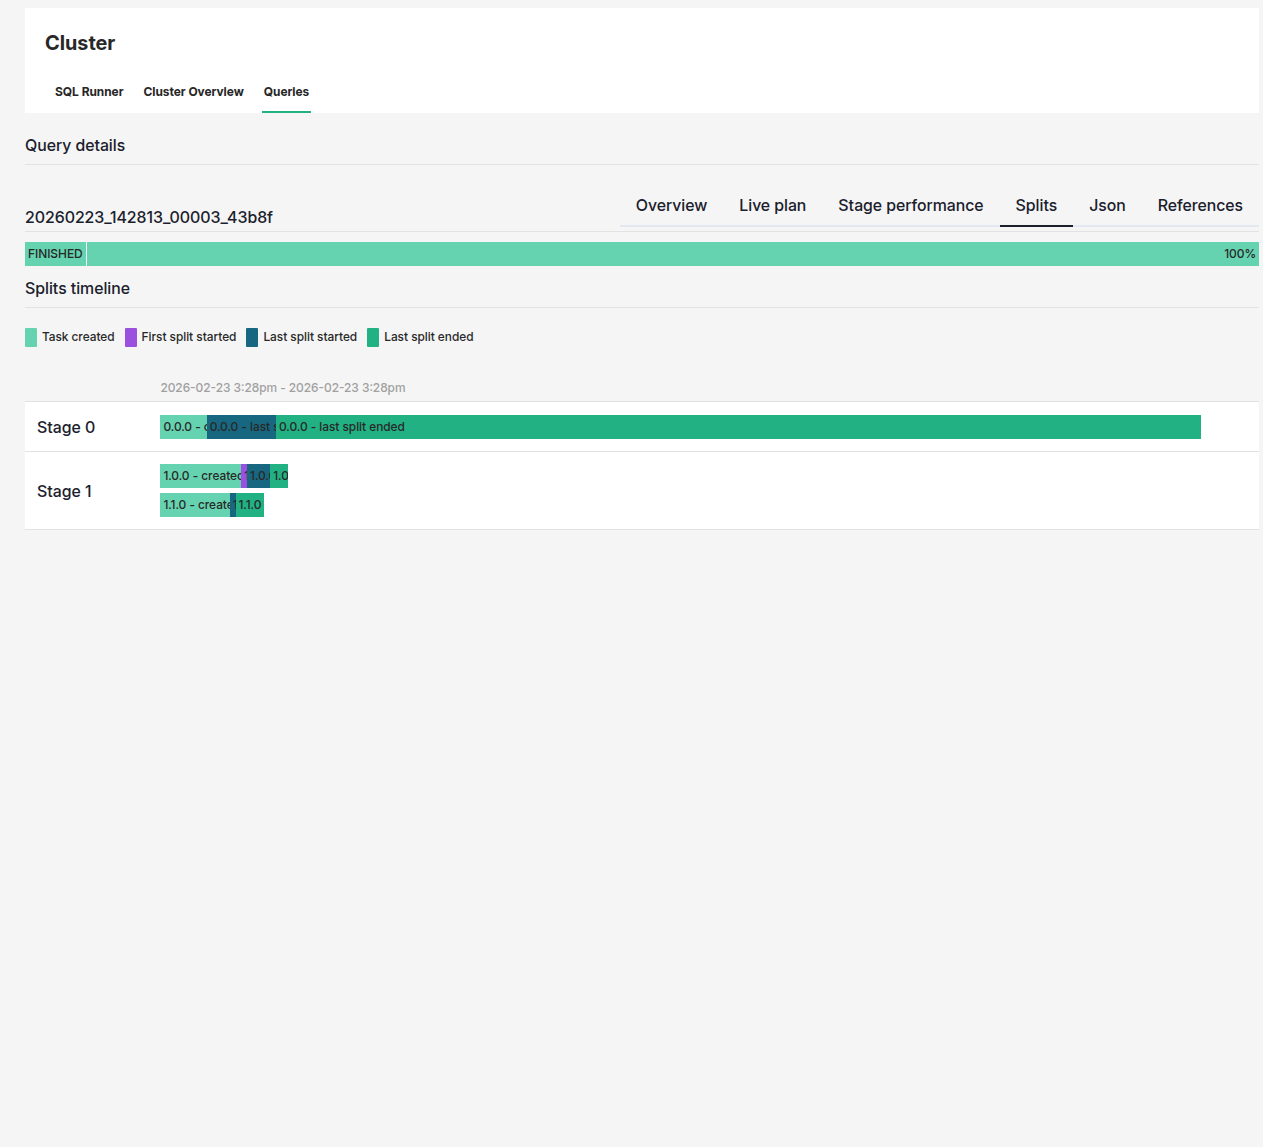
Splits#
Splits show how Trino parallelizes query execution. Each split represents a portion of data processed by a worker. View split-level metrics to understand query parallelism and data distribution.
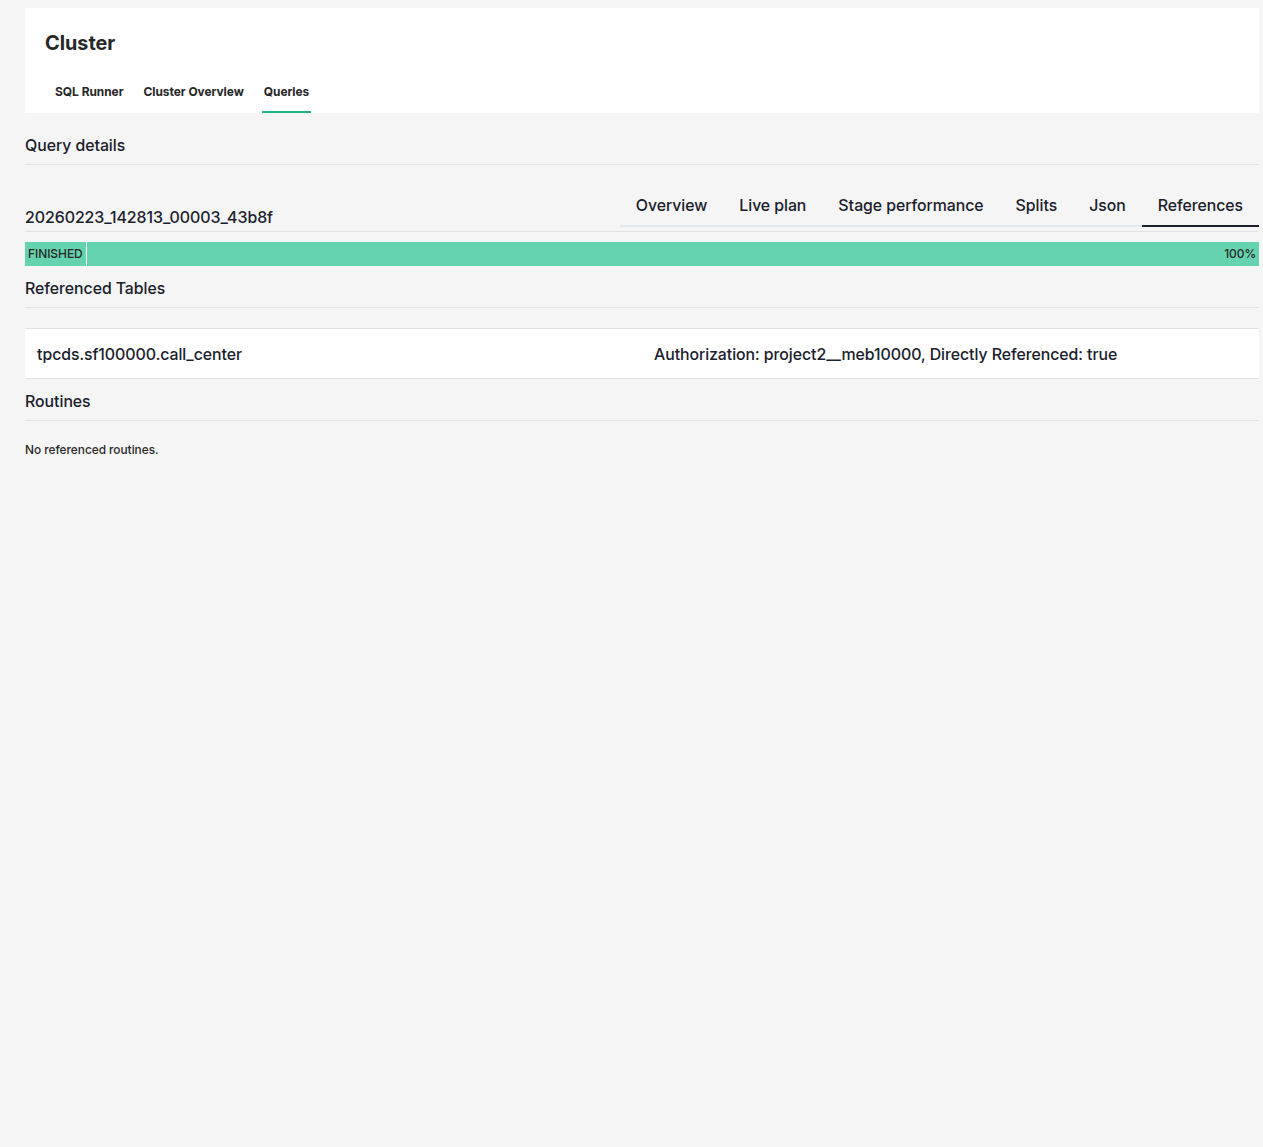
References#
The references tab lists the tables the query read, each with the user it was authorized as and whether the query named it directly, and the routines it called.
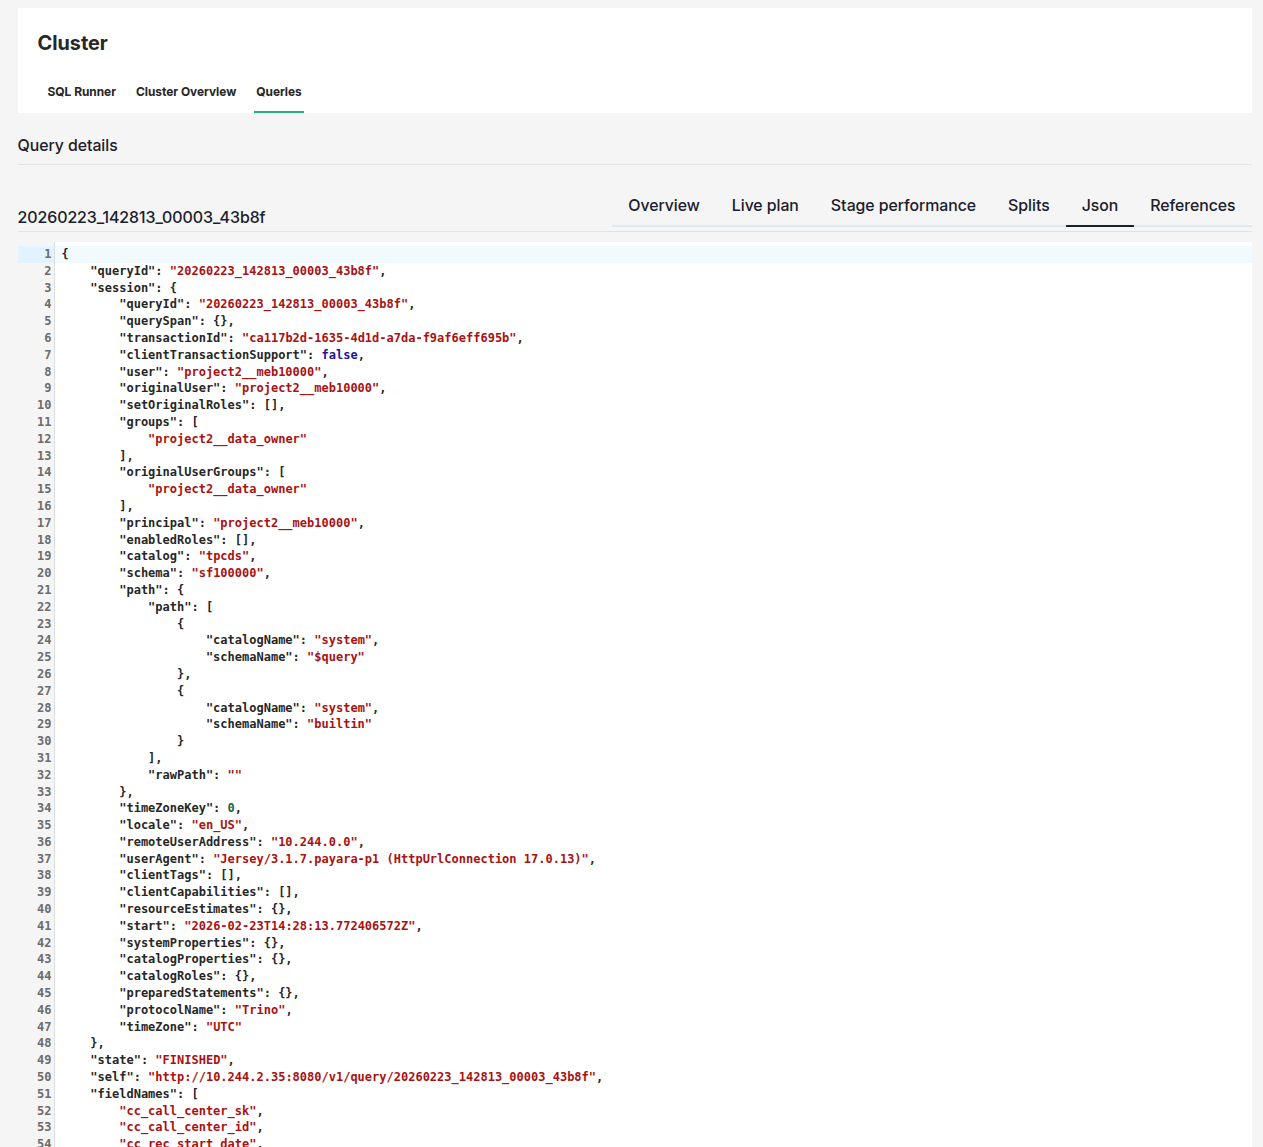
JSON#
The JSON view provides the complete query execution plan and statistics in JSON format, useful for programmatic analysis or debugging.
Best Practices#
- Limit result sets: Use
LIMITclauses for exploratory queries to reduce resource usage - Filter early: Apply
WHEREclauses to reduce data scanned - Monitor query performance: Check the Queries tab to identify slow or failed queries
- Use the live plan: For complex queries, review the execution plan to optimize performance
- Check cluster status: Ensure adequate resources are available before running large queries