Statistics Comparison
Hopsworks feature monitoring allows you to monitor your feature data once they have been ingested into the Feature Store. You can define detection and reference windows over your data for which Hopsworks will compute the statistics on a regular basis, compare them, and optionally trigger alerts when significant differences are detected. Statistics can be computed on all or a subset of feature values, and on one or more features simultaneously. Also, you can specify the criteria under which statistics will be compared and set thresholds used to classify feature values as anomalous.
Hopsworks stores both detection and reference statistics and enable you to visualise the temporal evolution of statistical metrics.
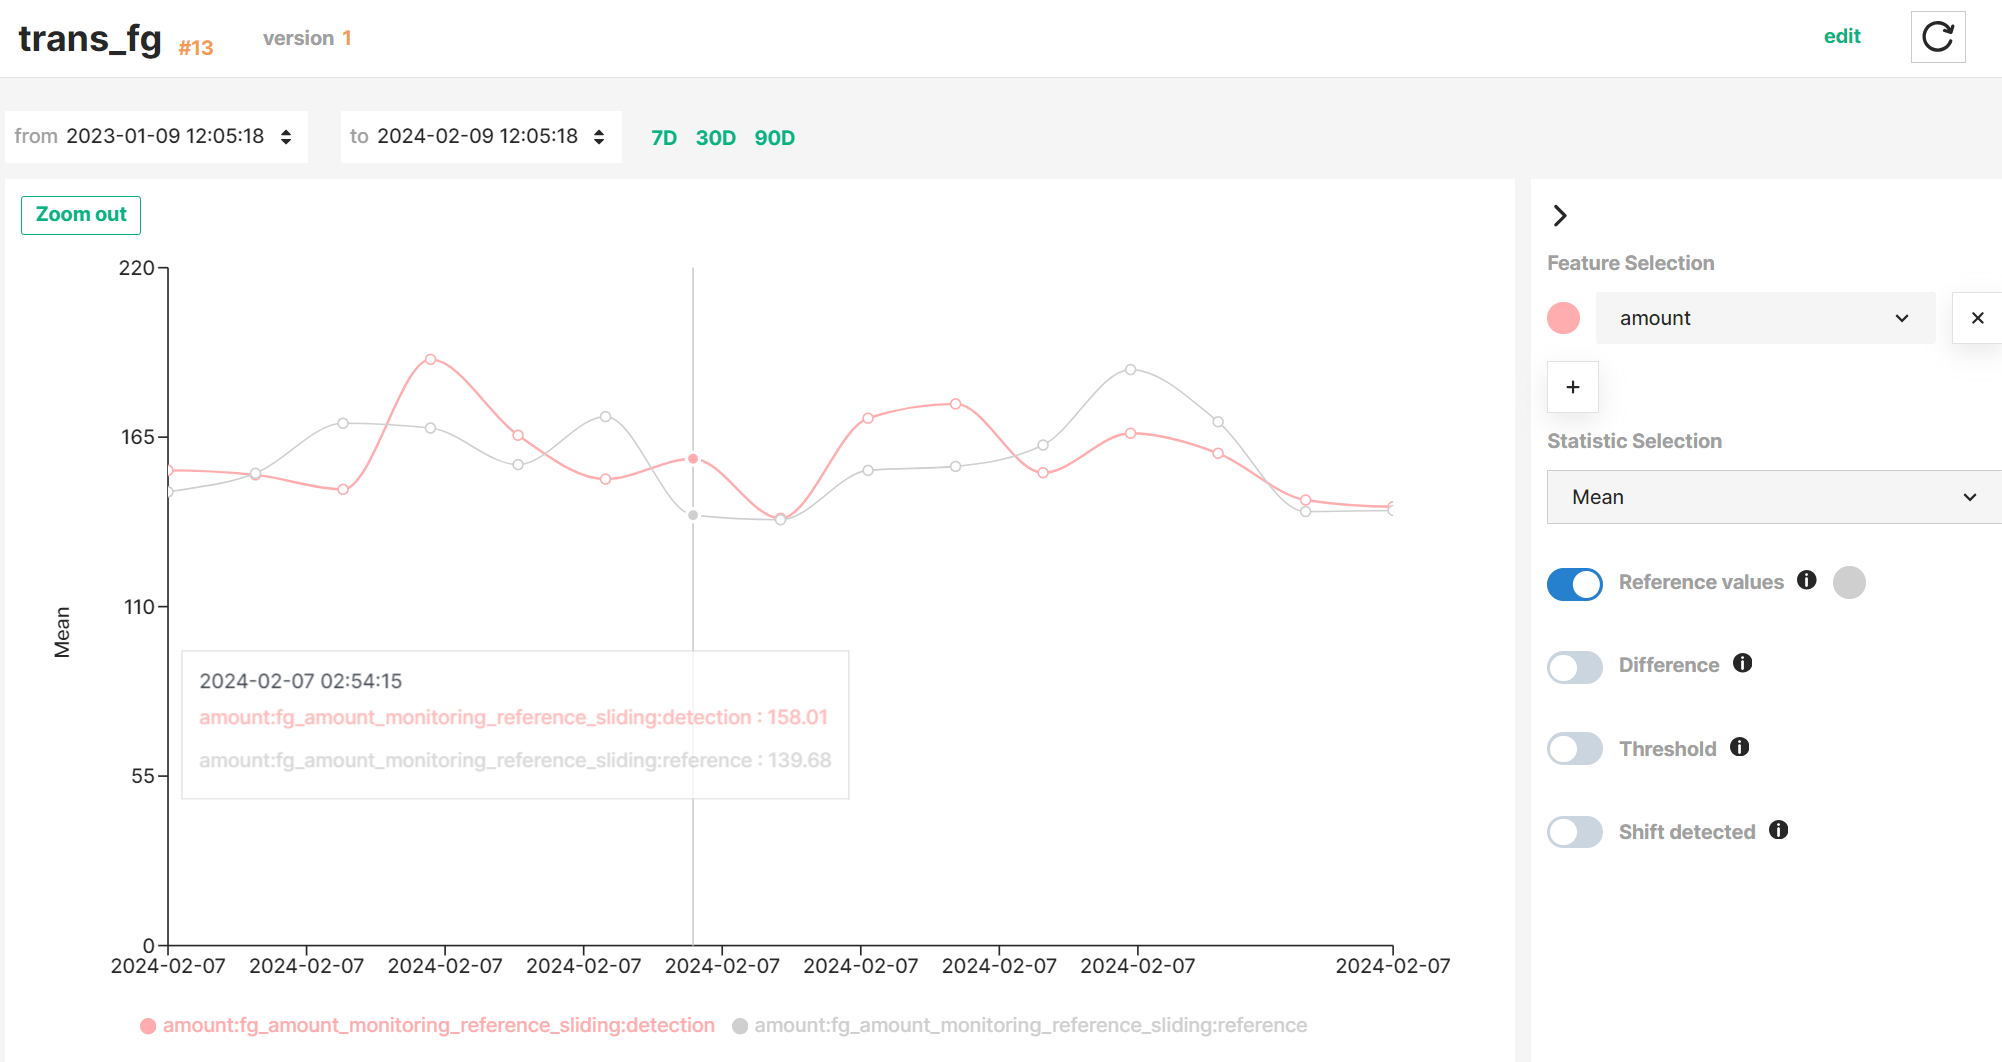
Interactive graph
See the Interactive graph guide to learn how to explore statistics and comparison results more efficiently.
Use cases#
Feature monitoring is a powerful tool that allows you to monitor your data over time and quickly detect anomalies in your feature data by comparing statistics computed on different windows of your feature data, notifying you about anomalies, and/or visualizing the evolution of these statistics and comparison results in a time series. It can be enabled in both Feature Groups and Feature Views, but for different purposes.
For Feature Groups, feature monitoring helps you rapidly identify unexpected trends or anomalous values in your Feature Group data, facilitating the debugging of possible root causes such as newly introduced changes in your feature pipelines. See the Feature Monitoring for Feature Groups guide to configure it.
For Feature Views, feature monitoring helps you quickly detect when newly inserted Feature Group data differs statistically from your existing training datasets, and decide whether to retrain your ML models using a new training dataset version or analyze possible issues in your feature pipelines or inference pipelines. See the Feature Monitoring for Feature Views guide to configure it.
Reference windows#
To compare statistics computed on a detection window against a baseline, you need to define a reference window of feature data. Reference windows can be defined in different ways depending on whether you are configuring feature monitoring on a Feature Group or Feature View.
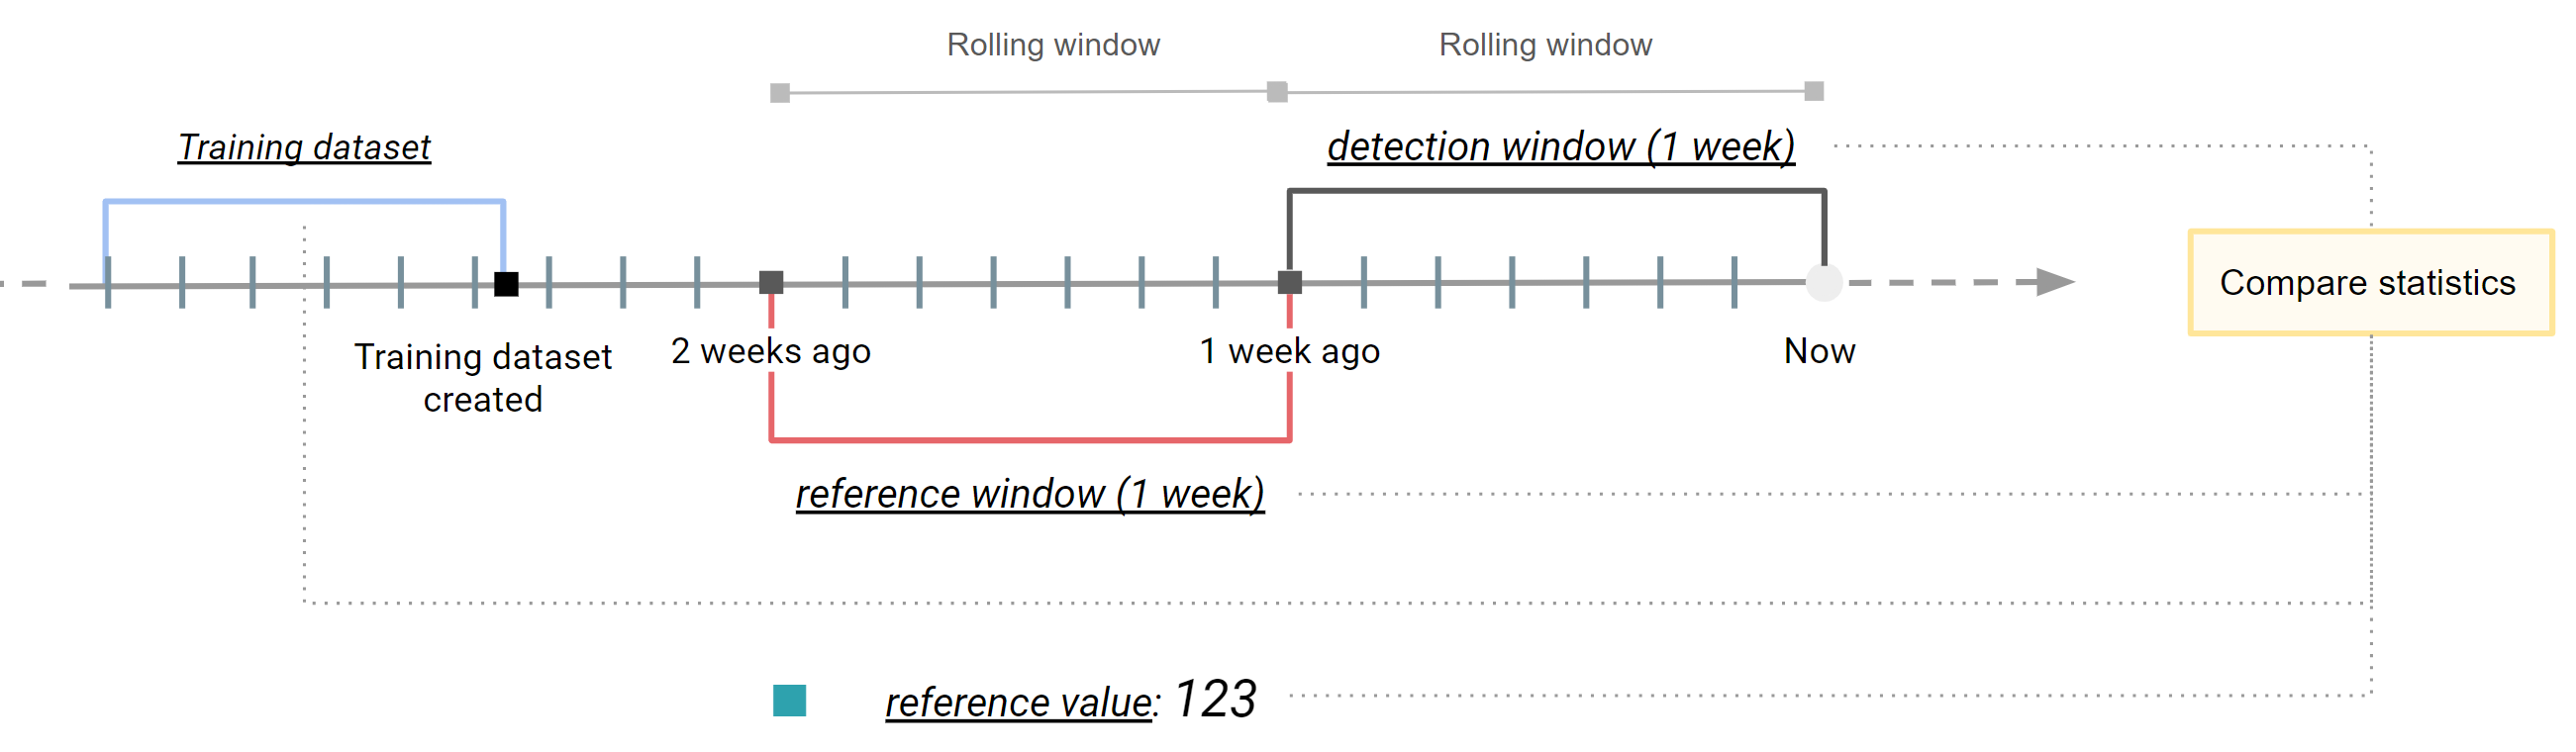
In a previous section we described different types of windows available. Taking a Feature View as an example, the figure above describes how these windows are applied to Feature Group data read by a Feature View query and Training data, resulting in the following applications:
- A expanding window covering the whole Feature Group data from its creation until the time when statistics are computing. It can be seen as an snapshot of the latest version of your feature data. This reference window is useful when you want to compare the statistics of newly inserted feature data against all the Feature Group data.
- A rolling window covering a variable subset of feature data (e.g., feature data written last week). It helps you compare the properties of feature data inserted at different cadences (e.g., feature data inserted last month and two months ago).
- A static window representing a snapshot of Feature Group data read using the Feature View query at a specific point in time (i.e., Training Dataset). It helps you compare newly inserted feature data into your Feature Groups against a Training Dataset version.
- A specific value. It helps you target the analysis of feature data to a specific feature and statistics metric.
See more details on how to define a reference window for your Feature Groups and Training Datasets in the Feature Monitoring guides for Feature Groups and Feature Views.
Comparison criteria#
After defining the detection and reference windows, you can specify the criteria under which computed statistics will be compared. The criteria described below apply to the comparison of a single scalar metric using the compare_on method.
Distribution comparison
Alternatively, you can compare the whole distribution of a feature between the detection and reference windows using metrics such as PSI or KL divergence. See the Distribution comparison guide for details.
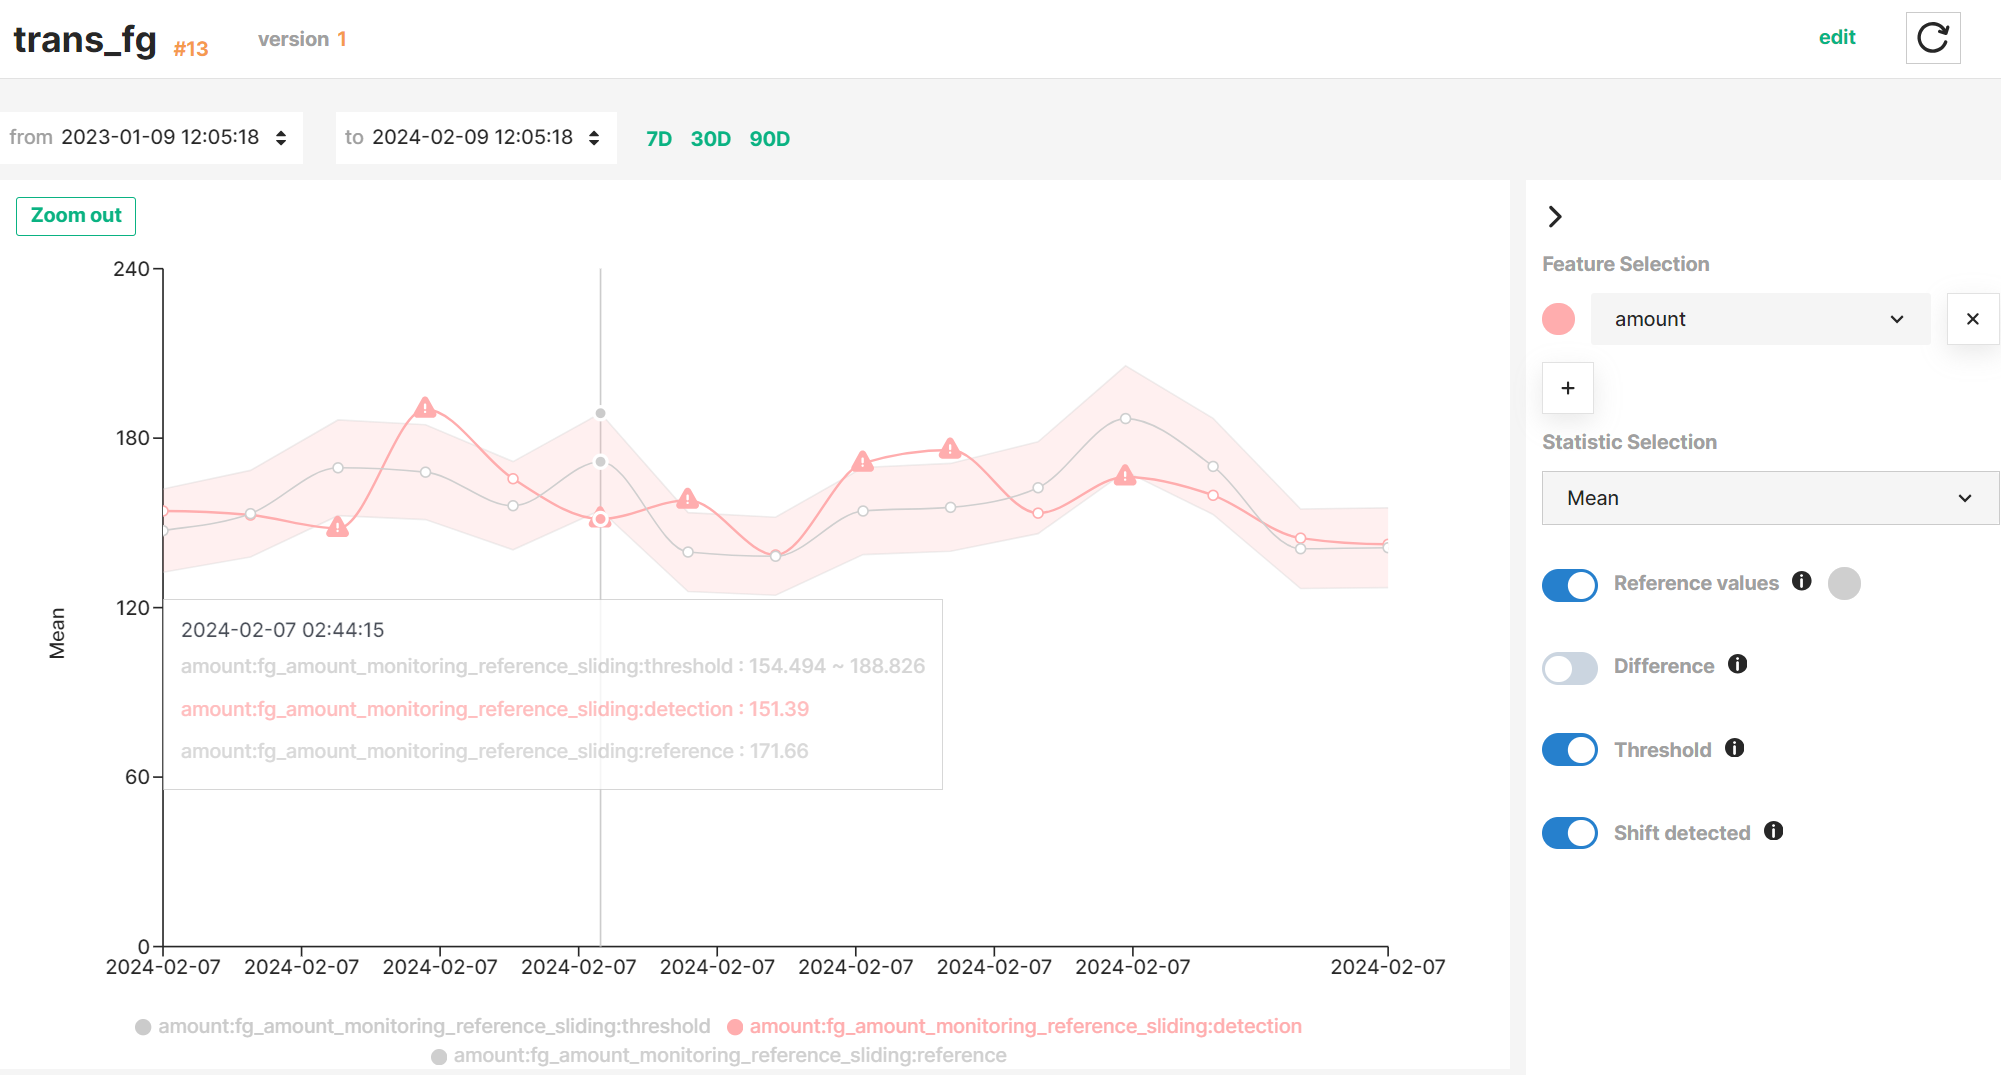
Hopsworks stores the results of each statistics comparison and enables you to visualise them together with the detection and reference values in a time series graph.
Next steps
You can setup alerts that will notify you whenever anomalies are detected on your feature data. See more details in the alerting section of the feature monitoring guide.