How To Inspect A Deployment State#
Introduction#
In this guide, you will learn how to inspect the state of a deployment.
A state can be seen as a snapshot of the current inner workings of a deployment. The following is the state transition diagram for deployments.
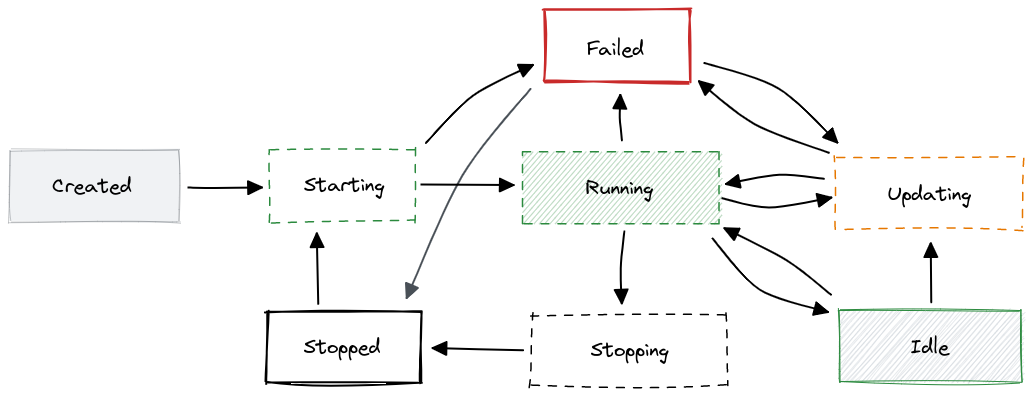
States are composed of a status and a condition. While a status represents a high-level view of the state, conditions contain more detailed information closely related to infrastructure terms.
GUI#
Step 1: Inspect deployment status#
If you have at least one deployment already created, navigate to the deployments page by clicking on the Deployments tab on the navigation menu on the left.

Once in the deployments page, find the deployment you want to inspect. Next to the actions buttons, you can find an indicator showing the current status of the deployment. This indicator changes its color based on the status.
To inspect the condition of the deployment, click on the name of the deployment to open the deployment overview page.
Step 2: Inspect condition#
Once in the deployment overview page, you can find the aforementioned status indicator at the top of page. Below it, a one-line message is shown with a more detailed description of the deployment status. This message is built using the current condition of the deployment.

Step 3: Check nº of running instances#
Additionally, you can find the nº of instances currently running by scrolling down to the resource allocation section.

Scale-to-zero capabilities
If scale-to-zero capabilities are enabled, you can see how the nº of instances of a running deployment goes to zero and the status changes to idle. To enable scale-to-zero in a deployment, see Resource Allocation Guide
Code#
Step 1: Connect to Hopsworks#
import hopsworks

project = hopsworks.login()

# get Hopsworks Model Serving handle
ms = project.get_model_serving()
Step 2: Retrieve an existing deployment#
deployment = ms.get_deployment("mydeployment")
Step 3: Inspect deployment state#
state = deployment.get_state()

state.describe()
Step 4: Check nº of running instances#
# nº of predictor instances
deployment.resources.describe()

# nº of transformer instances
deployment.transformer.resources.describe()
API Reference#
Deployment status#
The status of a deployment is a high-level description of its current state.
Show deployment status
| Status | Description |
|---|---|
| CREATED | Deployment has never been started |
| STARTING | Deployment is starting |
| RUNNING | Deployment is ready and running. Predictions are served without additional latencies. |
| IDLE | Deployment is ready, but idle. Higher latencies (i.e., cold-start) are expected in the first incoming inference requests |
| FAILED | Deployment is in a failed state, which can be due to multiple reasons. More details can be found in the condition |
| UPDATING | Deployment is applying updates to the running instances |
| STOPPING | Deployment is stopping |
| STOPPED | Deployment has been stopped |
Deployment conditions#
A condition contains more specific information about the status of the deployment. They are mainly useful to track the progress of starting or stopping deployments.
Status conditions contain three pieces of information: type, status and reason. While the type describes the purpose of the condition, the status represents its progress. Additionally, a reason field is provided with a more descriptive message of the status.
Show deployment conditions
| Type | Status | Description |
|---|---|---|
| STOPPED | Unknown |
Deployment is stopping. |
True |
Deployment is stopped. Therefore, no instances are running and no resources are allocated. | |
| SCHEDULED | Unknown |
Deployment is being scheduled |
False |
Deployment failed to be scheduled. This is commonly due to insufficient resources to satisfy the deployment requirements | |
True |
Deployment has been scheduled successfully. At this point, resources have been already allocated for the deployment. | |
| INITIALIZED | Unknown |
Deployment is initializing. This step involves initialization tasks such as pulling docker images or mounting data volumes |
False |
Deployment failed to initialized | |
True |
Deployment has been initialized successfully. At this point, the docker images have been pulled and data volumes mounted | |
| STARTED | Unknown |
Deployment is starting. In this step, the model server is started and predictor / transformer scripts (if provided) are executed |
False |
Deployment failed to start. This can be due to errors in the predictor / transformer script, missing dependencies or model server incompatibilities. | |
True |
Deployment has been started successfully. At this point, the model server has been started and the predictor / transformer scripts (if provided) executed. | |
| READY | Unknown |
Connectivity is being set up. |
False |
Connectivity failed to be set up, mainly due to networking issues. | |
True |
Connectivity has been set up and the deployment is ready |
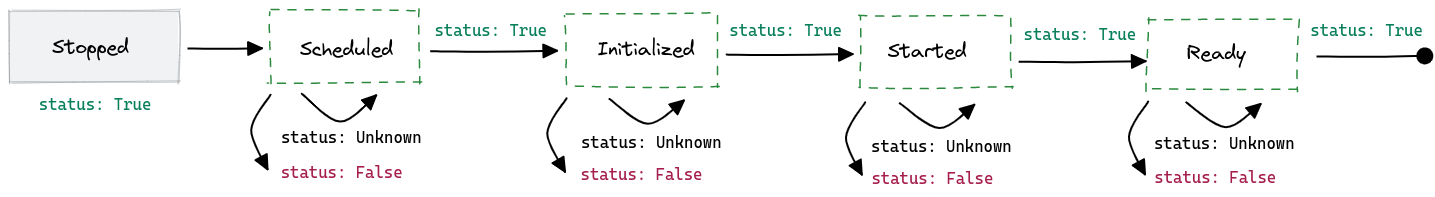
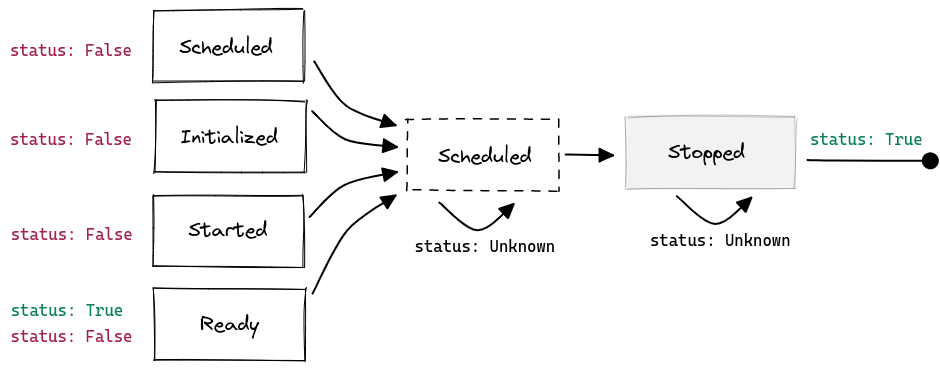
The following are two diagrams with the state transitions of conditions in starting and stopping deployments, respectively.